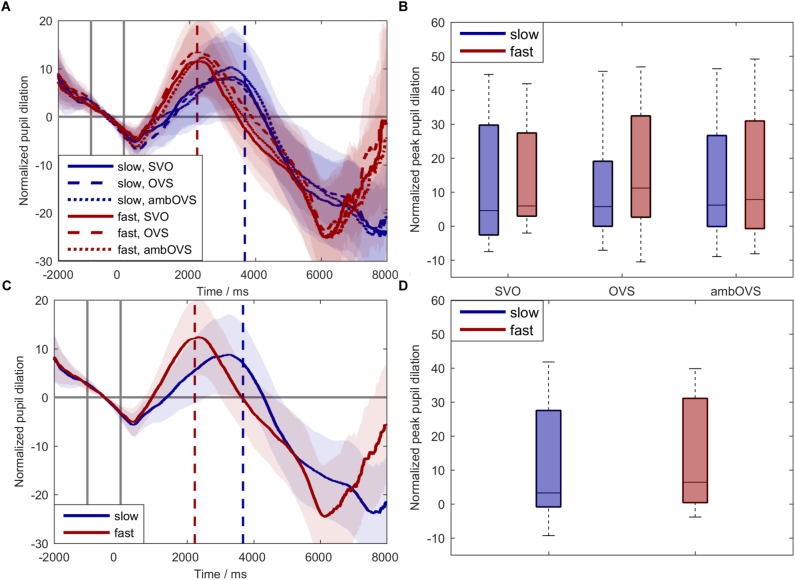
FIGURE 5.
Normalized pupil dilations across participants. Blue: slow speech; red: fast speech; solid lines: SVO; dashed lines: OVS; dotted lines: ambOVS. (A) Shows the normalized pupil dilation over time with the corresponding 95% confidence interval. (B) Shows boxplots of peak-pupil dilations (PPDs). (C) Shows the normalized pupil dilation over time with the corresponding 95% confidence interval collapsed across sentence structures. (D) Shows boxplots of PPDs collapsed across sentence structures. The first two solid vertical lines in (A,C) indicate the range of the baseline used for normalization. The blue and red dashed vertical lines indicate the averaged ends of slow and fast sentences. Repeated measures ANOVA revealed no main effect of linguistic complexity but a main effect of speech rate with larger PPDs for fast speech compared to slow speech.

