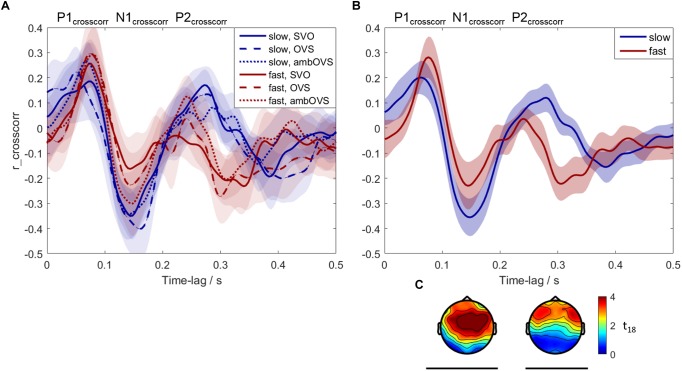
FIGURE 6.
Neural tracking of speech averaged across participants. Blue: slow speech; red: fast speech; solid lines: SVO; dashed lines: OVS; dotted lines: ambOVS. (A) Shows the averaged cross-correlations with the 95% confidence intervals between the speech-onset envelopes and the EEG signal. (B) Shows the cross-correlations with the corresponding 95% confidence intervals collapsed across sentence structures. The results in (A,B) were averaged over 19 participants and averaged over the 45 electrodes which were common for both significant clusters. The three components P1crosscorr, N1crosscorr, and P2crosscorr are marked. (C) Shows the topographical plots of t-values for the two significant clusters calculated with the cluster-based permutation procedure. Time lags at which the slow and fast speech differed significantly are indicated by black lines below the corresponding time intervals and topographical plots.

