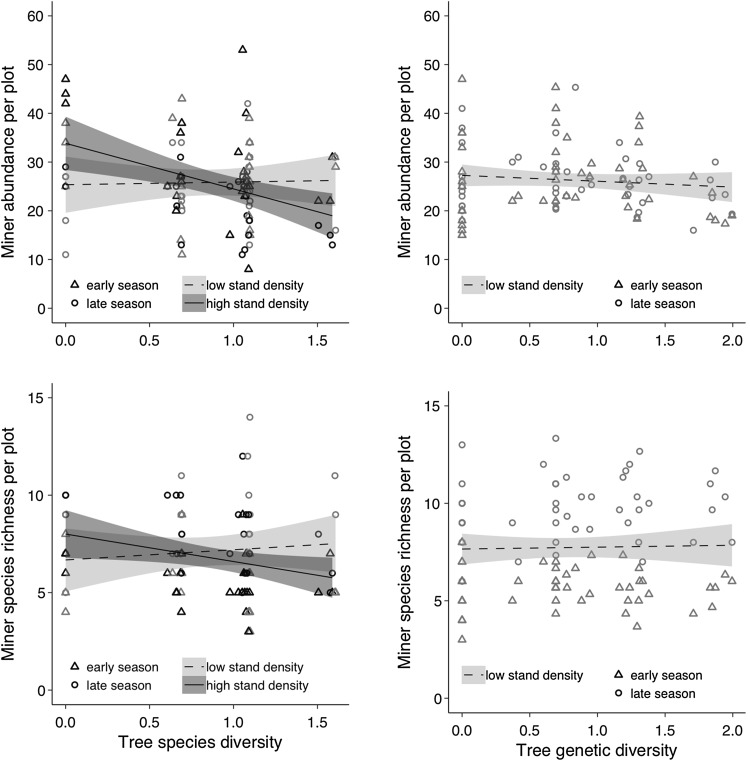
Fig. 2.
Birch leaf-miner abundance and species richness per plot (calculated as the sum across five sampled trees) as function of tree species diversity (right panels) and genetic diversity (left panels) in the SDE and in GDE (only 2014 data are displayed). Tree diversity is calculated using the Shannon index. Triangles symbols indicate data in the early season and circles indicate data in late season. Grey symbols indicate data in low stand density plots and black symbols indicate data in high stand density plots. Solid lines represent significant relationships (P < 0.05); dashed lines represent non-significant relationships (P > 0.05)

