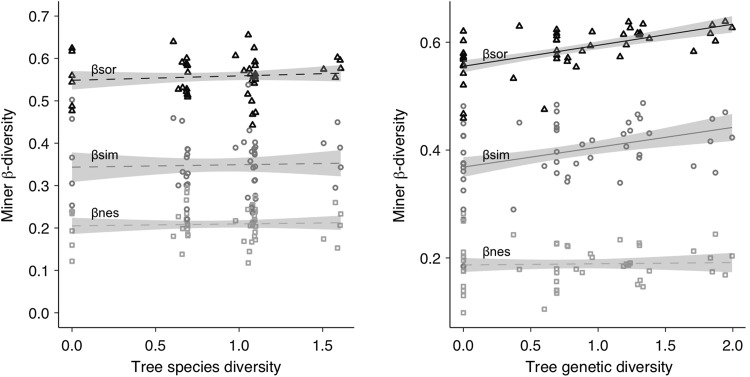
Fig. 5.
Leaf-miner β-diversity at tree level in SDE and GDE as function of tree species diversity (left panel) and tree genetic diversity (right panel). Data were averaged across years and season (and tree density treatment in the species diversity experiment). βsor: overall β-diversity (βsor), βsim: species turnover, βnes: species nestedness. Solid lines represent significant relationships (P < 0.05), dashed lines represent non-significant relationships (P > 0.05)

