
Figure 1.
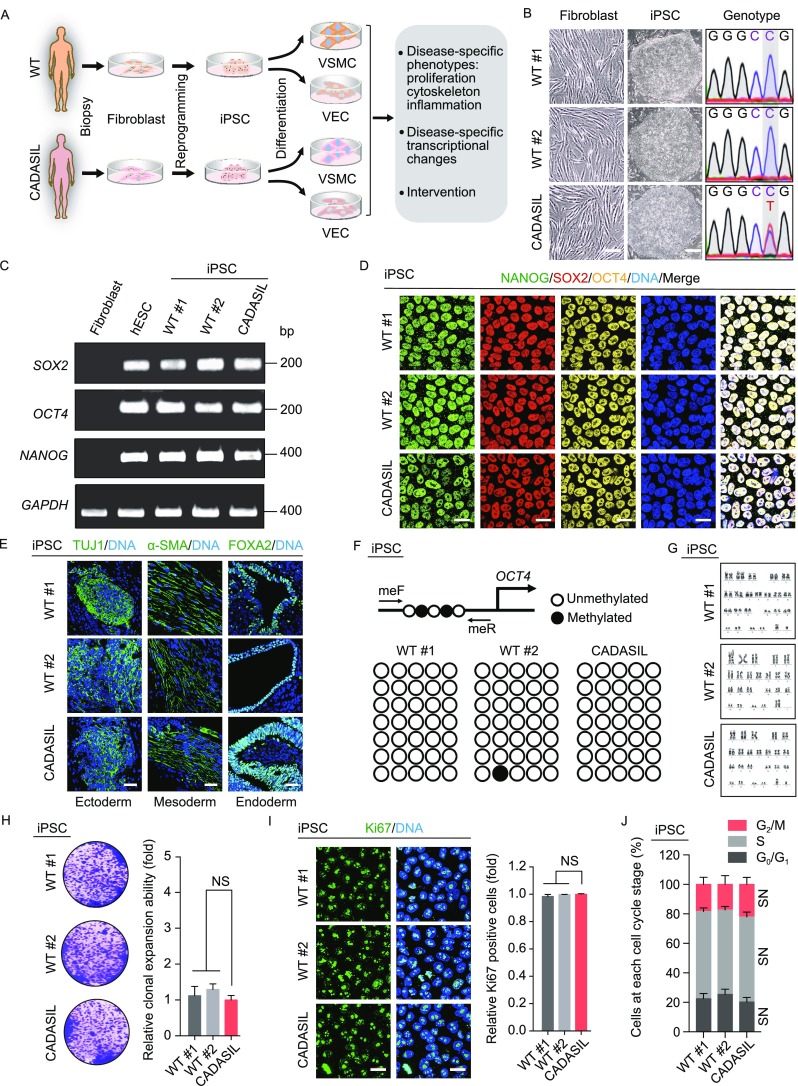
Generation and characterization of WT iPSCs and CADASIL iPSCs. (A) Schematic procedures for establishing iPSC-based CADASIL disease model. Fibroblasts obtained from one CADASIL patient and two healthy controls were reprogrammed into iPSCs. The iPSCs were then differentiated to generate VSMCs and VECs. Changes in disease-associated transcriptional profiling and cellular phenotypes were analyzed. (B) Confirmation of the heterozygous mutation of NOTCH3 (c.3226C>T, p.R1076C) in CADASIL iPSCs by DNA sequencing (right). Phase-contrast images of fibroblasts (left) and fibroblast-derived iPSCs (middle). Scale bar of fibroblasts, 50 μm; Scale bar of iPSCs, 100 μm. (C) RT-PCR of pluripotency markers, SOX2, OCT4, and NANOG. Human ESCs (hESCs) were used as positive controls and human fibroblasts as negative controls. (D) Immunofluorescence staining of pluripotency markers, NANOG, SOX2, and OCT4. Nuclei were stained with Hoechst 33342. Scale bar, 25 μm. (E) Immunofluorescence staining of TUJ1 (ectoderm), α-SMA (mesoderm), and FOXA2 (endoderm) in teratomas derived from WT and CADASIL iPSCs. Nuclei were stained with Hoechst 33342. Scale bar, 50 μm. (F) DNA methylation analysis of the OCT4 promoter in WT and CADASIL iPSCs. Open and closed circles indicate unmethylated and methylated CpG dinucleotides, respectively (n = 7). (G) Karyotyping analysis of WT and CADASIL iPSCs. (H) Clonal expansion analysis of WT and CADASIL iPSCs. Representative images of crystal violet staining are shown to the left. The statistical analyses of relative clonal expansion abilities are shown to the right (CADASIL was taken as reference). Data are presented as mean ± SD, n = 3. NS, not significant. (I) Immunofluorescence staining of Ki67 in WT and CADASIL iPSCs. Nuclei were stained with Hoechst 33342. Scale bar, 25 μm. The relative percentages of Ki67-positive cells are shown to the right (CADASIL was taken as reference). Data are presented as mean ± SD, n = 3. NS, not significant. (J) Cell cycle analysis of WT and CADASIL iPSCs. Data are presented as mean ± SD, n = 3. NS, not significant