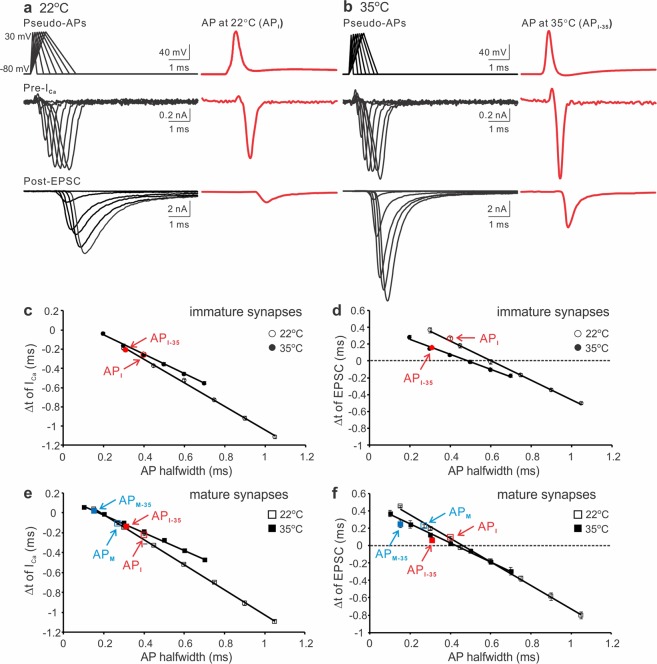
Figure 8.
Temperature dependence of the onset timing of ICa and EPSC. (a,b) Simultaneous recordings of ICa (middle panels) and EPSC (bottom panels) produced by pseudo- (left panels) and real APs (right panels) from P8-12 synapses at 22 °C (a) or 35 °C (b). Pseudo APs at 22 °C (a, top left): −80 to 30 mV, depolarization time from 0.1 to 0.7 ms with 0.1 ms increments, repolarization time from 0.2 to 1.4 ms with 0.2 ms increments. Pseudo APs at 35 °C (b, top left): −80 to 30 mV, depolarization time from 0.1 to 0.7 ms with 0.1 ms increments, repolarization time from 0.1 to 0.7 ms with 0.1 ms increments. The real AP recorded at 22 °C (API, a top right) is the same as described in Fig. 4. The real AP recorded at 35 °C (API-35, b top right) from a P11 calyx: −80 to 30 mV, depolarization and repolarization time 0.4 and 0.5 ms respectively, halfwidth 0.3 ms. (c,d) The time differences (Δt) between the start of ICa (c) or EPSC (d) and the end of AP repolarization phase were summarized for 22 °C (open circles, n = 7) and 35 °C (filled circles, n = 6). (e,f) Summary plots of the onset timing of ICa (e) and EPSC (f) evoked by the same pseudo- and real AP templates in P16-20 synapses at 22 °C (empty squares, n = 8) or 35 °C (black squares, n = 5).

