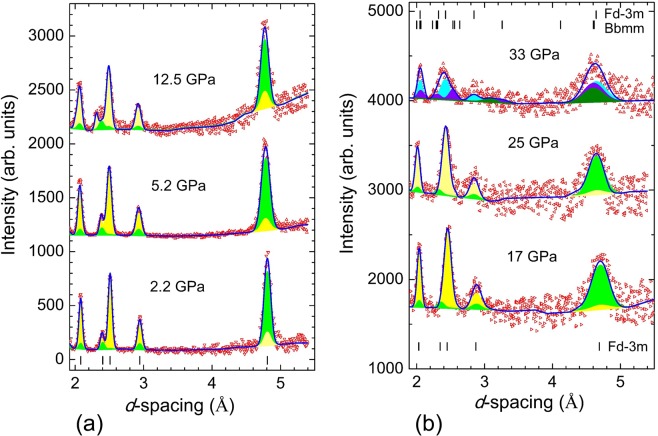
Figure 5.
The neutron diffraction patterns of Fe3O4 measured with the sapphire anvil high-pressure cell up to 12.5 GPa (a) and the DAC up to 33 GPa (b) at ambient temperature. The experimental points and calculated profiles are shown. Tick marks represent the calculated positions of nuclear peaks for the cubic spinel crystal structure of Fd m symmetry and the orthorhombic crystal structure of Bbmm symmetry (for P = 33 GPa). For the diffraction patterns, corresponding to the spinel phase (0–25 GPa), the contributions from nuclear and magnetic structures are shown in yellow and green colors. For the diffraction pattern, measured at P = 33 GPa, the total contributions from nuclear and magnetic structures, corresponding to the spinel and post-spinel phases, are shown in cyan and violet colors. For the post-spinel phase, the magnetic contribution is also shown in olive color.

