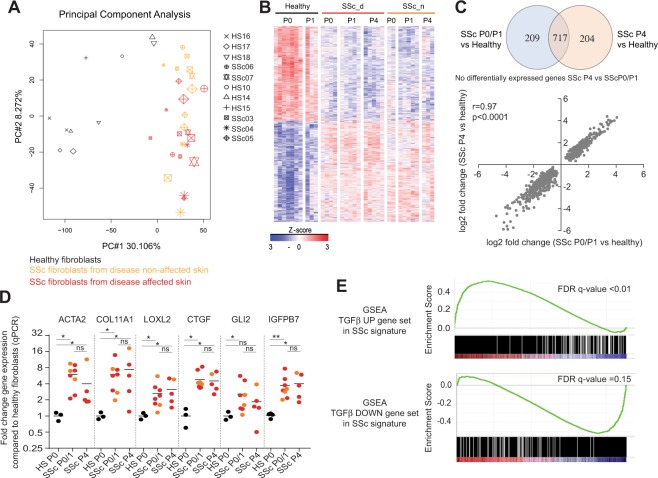
Figure 1.
Microarray gene expression analyses of freshly isolated and in vitro cultured primary SSc dermal fibroblasts. Microarray gene expression data from fibroblasts from Passage 0 to Passage 4 from 5 SSc patients (isolated from disease affected skin (SSc_d) or non-disease affected skin (SSc_n)) and 7 healthy donors were analyzed. (A) Principal Component Analysis. (B) Z-score heatmap showing the gene expression profiles of the differentially expressed probes between SSc dermal fibroblasts at P0/P1 and healthy dermal fibroblasts at P0/P1. (C) Overlap of the differentially expressed genes from SSc dermal fibroblasts P0/P1 compared to healthy dermal fibroblasts and from SSc dermal fibroblasts P4 compared to healthy dermal fibroblasts. (D) Quantitative PCR validation data from fibroblasts from at least 5 SSc patients isolated from non-affected skin (orange) or affected skin (red) and 3 healthy donors (black). Statistical significance was assessed using Mann-Whitney test with *p < 0.05 and **p < 0.01. (E) Gene Set Enrichment Analysis of a published in vitro TGFβ gene signature in the SSc signatureTop panel shows a Venn diagram showing the number of unique and overlapping differentially expressed genes. Bottom panel is a plot showing correlation between the log2 fold changes of the union of the differentially expressed genes.

