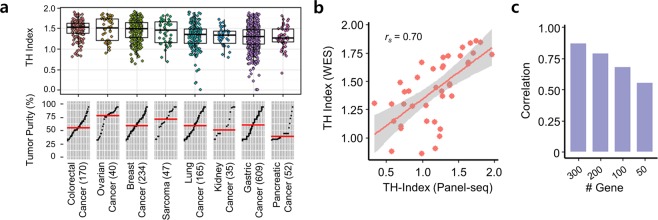
Figure 1.
Tumor heterogeneity measurement from cancer panel sequencing. (a) Tumor heterogeneity (TH) indices and tumor purities for 1,352 tumors from 8 types of cancer. Each point corresponds to a sample. Tumor purities were sorted and the red horizontal line indicates the median value. (b) Scatter plot between TH indices measured using either cancer panel sequencing or whole-exome sequencing. (c) Correlation between TH indices calculated using 381 genes and those indices using a subset of those genes.

