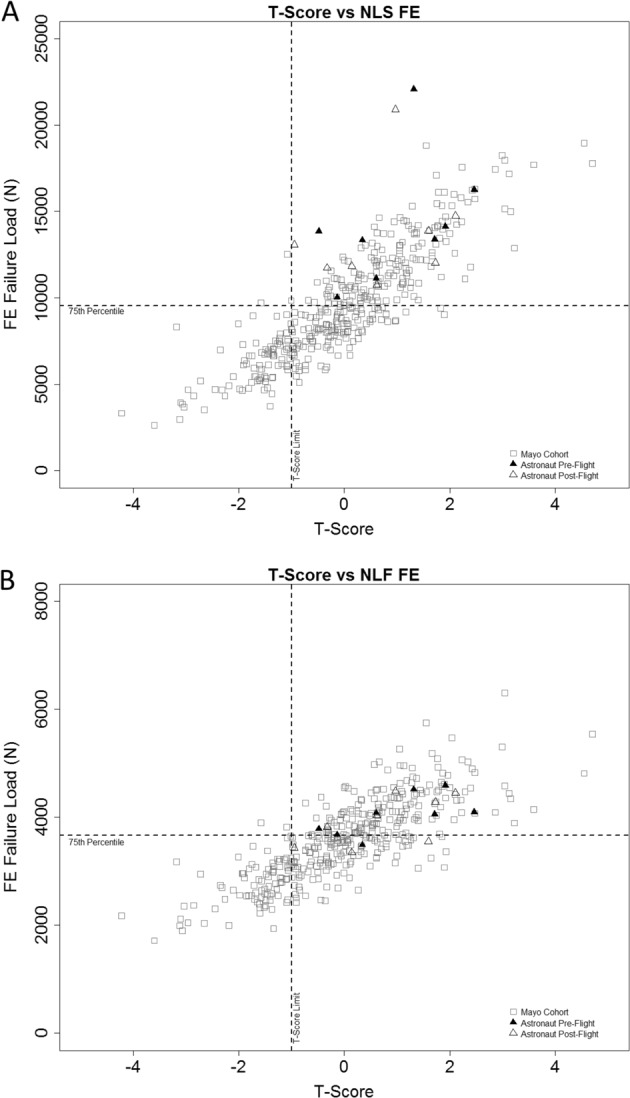
Fig. 4.

a Nonlinear stance clinical chart with T-score and FE load capacity. The vertical dashed line represents the DXA clinical standard at a T-score of −1.0 and the horizontal dashed line represents the 75th percentile FE load capacity cut-point at 9537N. b Nonlinear fall clinical chart with T-score and FE load capacity. The vertical dashed line represents the DXA clinical standard at a T-score of −1.0 and the horizontal dashed line represents the 75th percentile FE load capacity cut-point at 3664N
