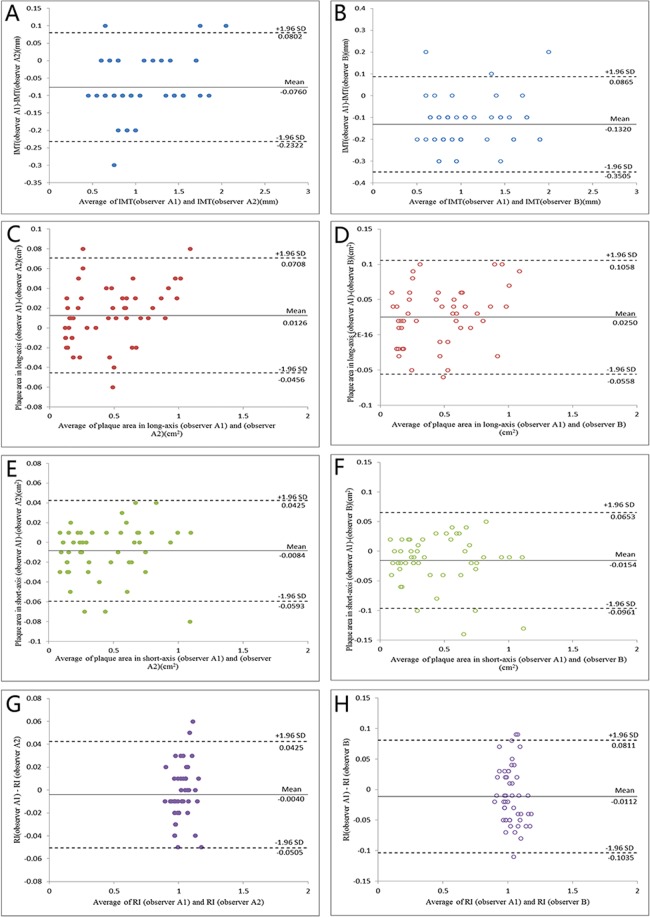
Figure 5.
Bland-Altman Plots of Intra-observer and Inter-observer Variability in Measurement of IMT (A,B), Plaque Area in long-axis views (C,D) and short-axis views (E,F) and Vascular Remodeling Index (G,H). The intraclass correlation coefficients of intra-observer variability for IMT, plaque area in long- and short-axis views and RI were 0.982, 0.915, 0.906 and 0.905, respectively (P < 0.001 for all), and those of inter-observer variability for IMT, plaque area in long- and short-axis views and RI were 0.963, 0.911, 0.890 and 0.804, respectively (P < 0.001 for all).

