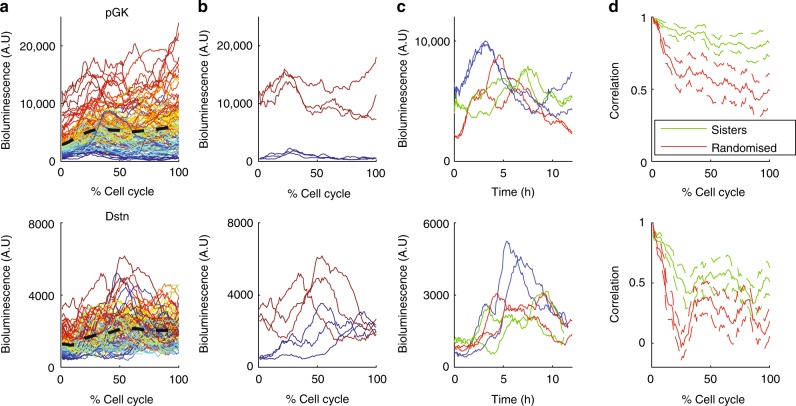
Fig. 2.
Single-cell reporter profiles and their correlation between sister cells. a Single-cell transcriptional reporter time series (total intensity per cell) for two genes (top: Pgk, 59 pairs of cells; bottom: Dstn, 50 pairs), measured from one cell division to the next (time is expressed in % of cell cycle time). Cells are colour-coded according to the ranking of the initial reporter level within the population. Dotted black line: population mean. b The top three cells with the highest/lowest initial reporter levels. c Examples of three pairs of sister cells (sister cells have the same colour). d The decrease in correlation between sister cells over the cell cycle. Green: correlation between sister cells; red: correlation between random cells, where each cell is matched with a non-sister with the nearest initial values. Error bars denote standard deviations obtained with bootstrap sampling

