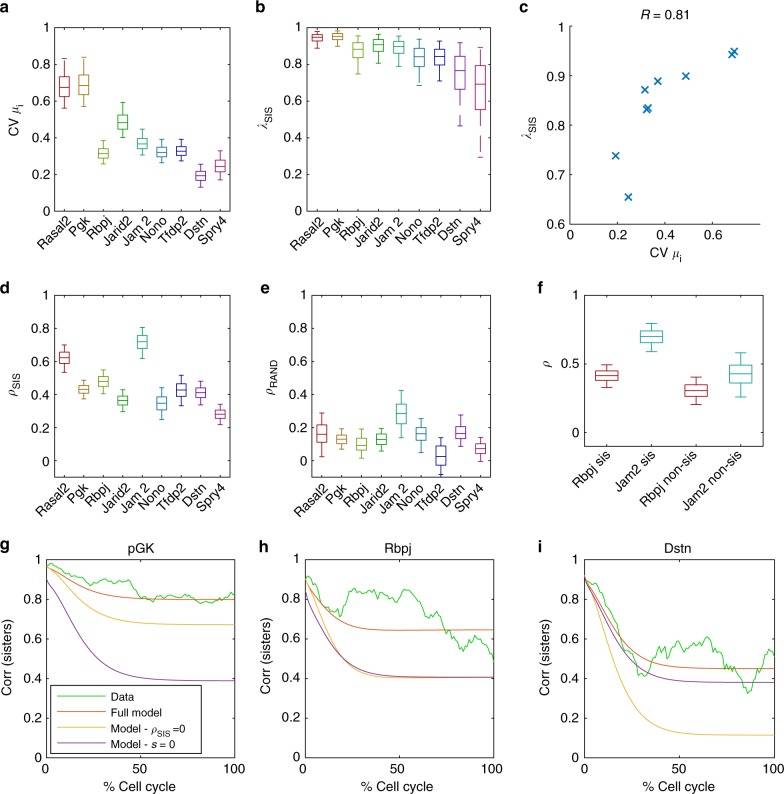
Fig. 4.
Quantification of features contributing to sister-cell correlation. a Posterior distributions (shown as boxplots) of the coefficient of variation (CV) for cell-specific means μi, calculated from the posterior distributions of s and m. The boxplots represent the 25th, median (50th) and 75th percentiles of the posterior distribution and the whiskers represent the 5th and 95th percentiles. b Posterior distributions of the correlation of mean transcriptional activity between sister cells (λSIS). c λSIS correlates with CV of cell-specific means (crosses denote mean posterior values for each gene). d The inferred posterior probability distribution of the similarity in dynamics (ρSIS) between sister cells. e The inferred posterior probability distribution of the similarity in dynamics (ρRAND) between randomised cells, where the randomisation ensures that cells have the same correlation in cell-cycle lengths as sister cells. f The inferred posterior probability distribution of the similarity in dynamics ρ for both sister cells and non-sister cells with the same average distance as non-sister cells. g–i Decrease in correlation between sister cells over the cell cycle. Green—the evolution of the sister-cell correlation over the cell cycle from the data, where time is expressed in % of cell cycle time. Red—the parameter posterior means for each gene are used to predict the evolution of sister-sister correlation over the cell cycle from the model, which is normalised to the average cell cycle length (13.5 h). Yellow—the correlation between sisters is recalculated with ρSIS = 0. Violet—the correlation between sisters is recalculated with s = 0, which removes cell-specific means from the model

