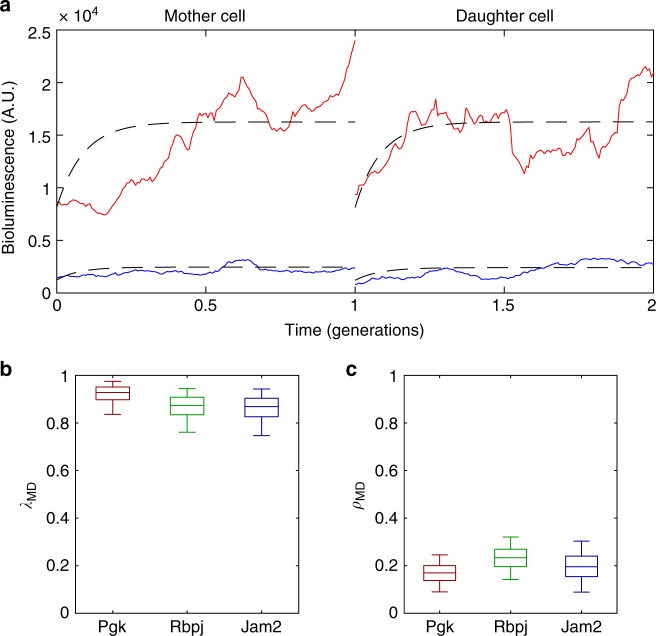
Fig. 5.
Highly correlated transcriptional activities between mother and daughter cells. a Examples of two pairs of mother and daughter cells from the pGK gene. Red and blue represent different pairs of cells. b Posterior distribution (shown as boxplots) of the correlation of mean transcriptional levels (λMD) between mother and daughter cells. The box represents the 25th, median (50th) and 75th percentiles of the posterior distributions and the whiskers represent the 5th and 95th percentiles. c Inferred posterior probability distribution of the similarity in dynamics (ρMD) between mother and daughter cells

