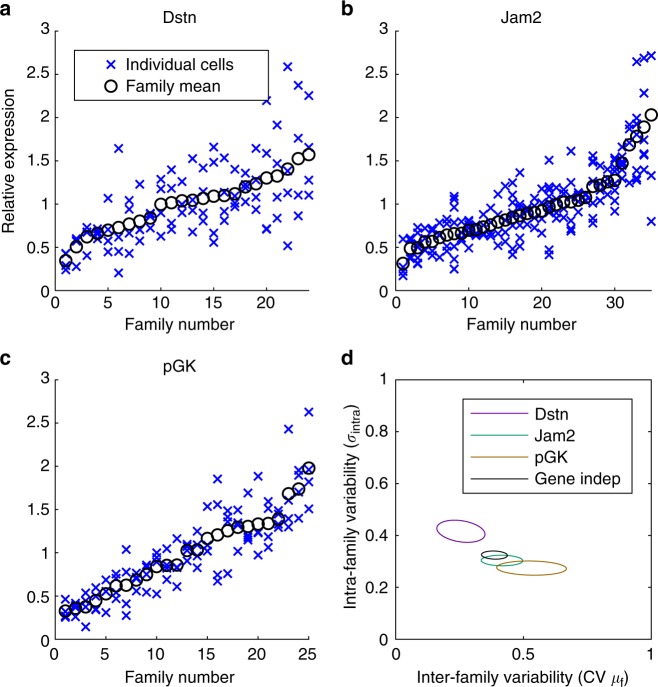
Fig. 6.
Spread and multi-generational memory of transcriptional levels. a–c Distribution of transcriptional reporter levels in different families. For each family, crosses represent averaged luminescence levels from three frames preceding nuclear envelope breakdown in individual cells. Circles represent the mean of the family. d Posterior distributions of the parameters from the Bayesian hierarchical model for family data (see Methods). The inter-family variability represents the CV of family means (μf), which is calculated from m and s, and the intra-family variability is represented with . Ellipses represent posterior means ± SD. The black ellipse represents the gene-independent model, where the parameters of the model were assumed to be the same for all three genes

