
Figure 2.
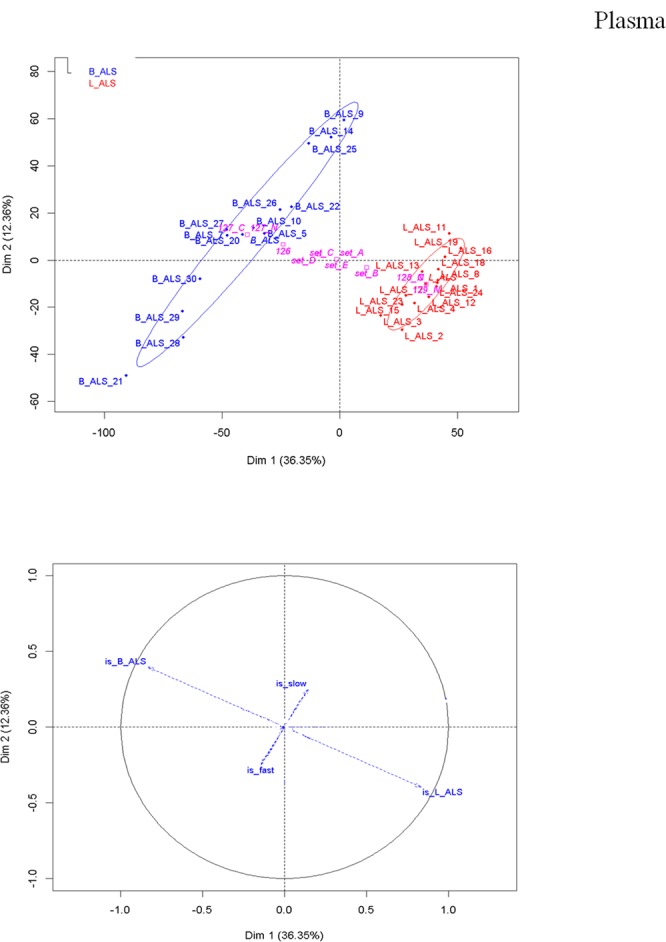
Plasma/brain matrix - peptide level analysis. PCA score plot (upper) and loading plot (bottom) after median normalisation. In the PCA plot, B-ALS (blue) displays a higher degree of variability in the peptide profile compared to the L-ALS (red) and this is in agreement with the results of the PBMCs. The loading plot shows that B-ALS group anticorrelates with the L-ALS group, as indicated by the opposite direction of the vectors representative of B-ALS and L-ALS. As observed in PBMC proteome, the rate of progression contributes to the separation along the PC2.