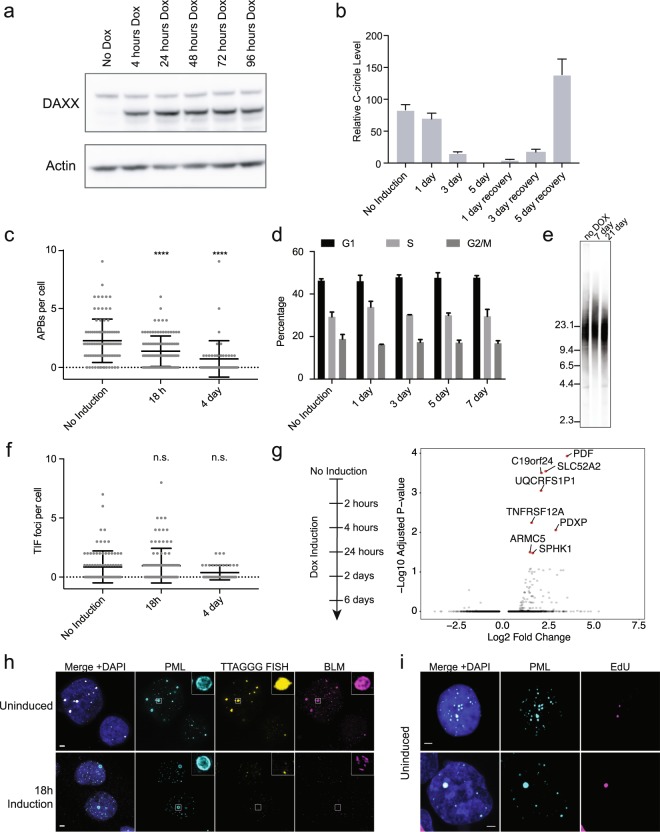
Figure 4.
Inducible expression of wild-type DAXX in G292 abrogates ALT with rapid kinetics. (a) Western blot with anti-DAXX antibody showing kinetics of DAXX induction in the G292-iDAXX cell line. DAXX was induced using 10 ng/mL doxycycline. All cropped images are from the same gel, which was stripped and reprobed. Complete images in Supplementary Fig. S4a. (b) C-circles were assayed using the qPCR protocol. C-circles began to decrease immediately upon DAXX induction and were eliminated after 5 days of continuous DAXX expression. C-circles returned after DAXX induction was stopped, showing that shutdown of ALT is reversible in this cell line. (c) Quantification of APBs using TTAGGG FISH and PML immunofluorescence in G292-iDAXX. Colocation was quantified using previously reported tools13. A significant reduction in APBs was observed as soon as 18 h after DAXX induction (ANOVA multiple comparisons test p < 0.001), samples images in Supplementary Fig. S4b. (d) FACS cell cycle analysis using propidium iodide showed no changes in cell cycle progression after a week of continuous DAXX expression in G292-iDAXX (p = 0.92, 2-way ANOVA). Plots represent the mean of triplicate cultures. Sample FACS traces and fits are found in Supplementary Fig. S4c. (e) Telomere length Southern blot showed undetectable levels of telomere erosion after DAXX expression of up to three weeks. Blank lanes were cropped. (f) Quantification of TIFs using TTAGGG FISH and 53BP1 immunofluorescence in G292-iDAXX. Colocation was quantified as for APBs. TIFs per cell were not significantly reduced after 4 days of DAXX expression (p = 0.95 at 18 h, p = 0.09 at 4d; ANOVA multiple comparisons test), samples images in Supplementary Fig. S4b. (g) Volcano plot of comparing RNA-seq data from short-term DAXX induction for the indicated time points compared to uninduced cells reveals minimal consistent changes in gene expression. (h) Structured illumination imaging of immunofluorescence plus TTAGGG FISH in G292-iDAXX. Large APBs including strong telomere FISH signal and BLM helicase were common in the ALT state but appeared to be lost rapidly after DAXX induction. Contrast was increased for 18 h induction insets to reveal details. Scale bars represent 2 µm. (i) PML IF plus EdU imaging demonstrated that APBs are a site of new DNA synthesis in the ALT state. EdU is incorporated at the site of new DNA synthesis. In G292-iDAXX cells in the ALT state, EdU is incorporated at PML bodies, even outside of S-phase. Scale bars represent 2 µm.

