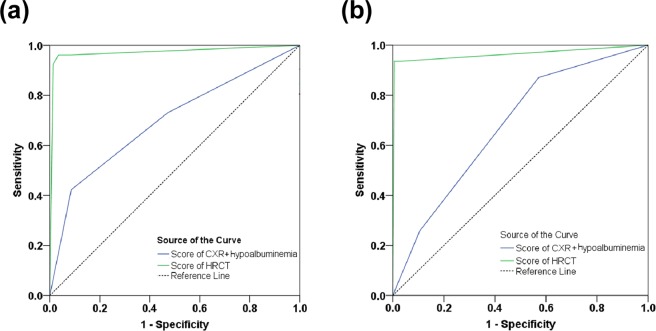
Figure 3.
Area under curve (AUC) of the CXR model. The Receiver operator characteristic (ROC) curve of the derivation cohort (a) and the validation cohort (b). The area under the ROC curve was derived as 0.698 (95% CI = 0.579 to 0.817) for score of score of [CXR + Hypoalbuminemia] model and 0.972 (95% CI = 0.927 to 1.000) for score of HRCT model in derivation cohort. They are under of the ROC curve was derived as 0.677 (95% CI = 0.586 to 0.769) for score of [hypoalbuminemia + CXR] model and 0.964 (95% CI = 0.913 to 1.000) for Score of HRCT model.

