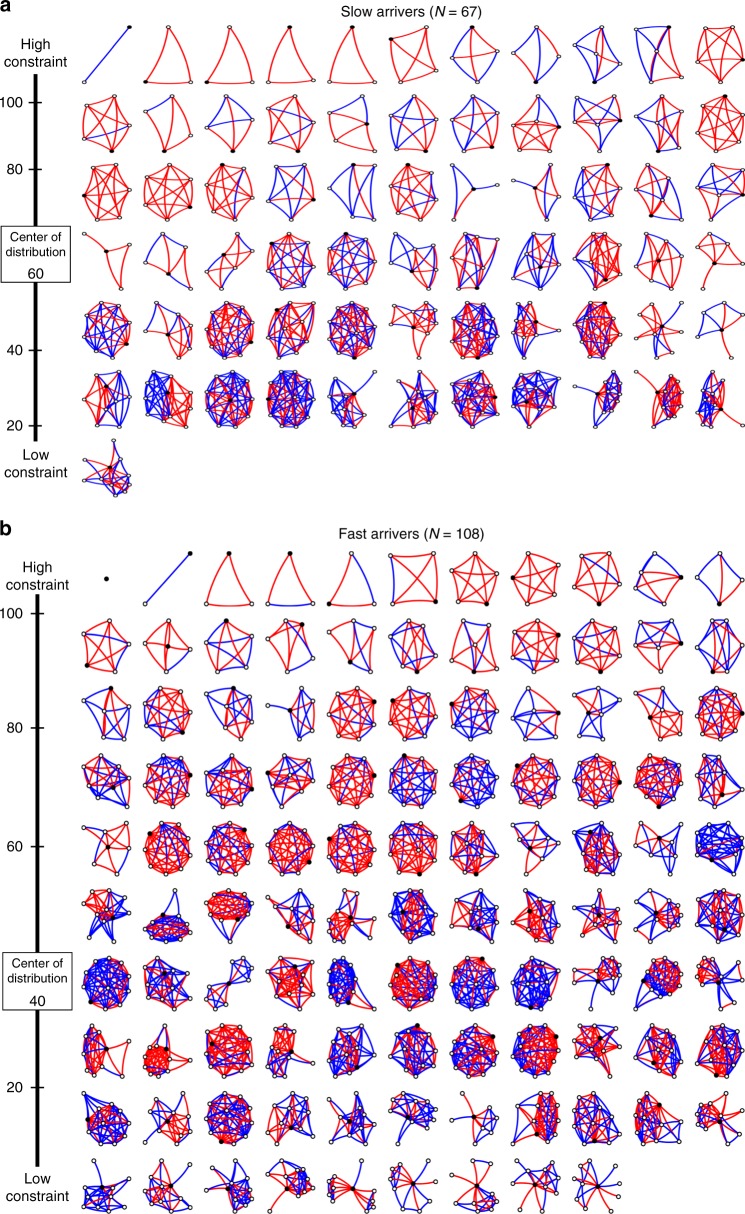
Fig. 2.
Personal networks of patients with ischemic stroke, according to slow and fast arrival. Each black circle represents one patient in the study embedded inside his/her social network. Line color indicates strength of relationship: red lines are strong ties and blue lines are weak ties. Networks are arranged from highest constraint (top left) to lowest constraint (bottom right) with scale and median along the left margin. In general, slow arrivers’ networks had higher constraint compared to fast arrivers’ networks

