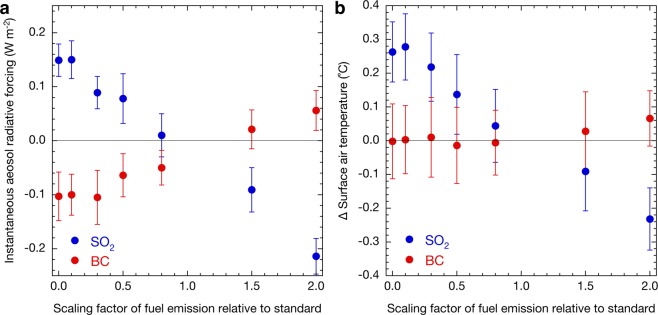
Figure 1.
Sensitivities to changes in SO2 and BC emissions. Global mean instantaneous aerosol radiative forcing (a) and change in the mean surface air temperature (b) with emission perturbations of SO2 (blue) and BC (red) from fuel sources relative to the present emissions simulated by MIROC-SPRINTARS. Error bars represent one standard deviation in annual mean values. Changes in surface air temperatures are from the simulations coupled with OGCM.

