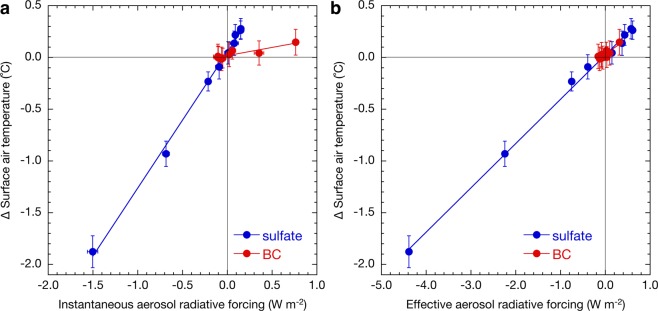
Figure 2.
Relationship between aerosol (a) instantaneous or (b) effective radiative forcing and changes in surface air temperatures. Each point shows individual simulated results with various scaling factors relative to present emission amounts, as shown in Methods, for sulphate (blue) and BC (red) aerosols by MIROC-SPRINTARS. Error bars represent one standard deviation in annual mean values. The correlation coefficients for the regression lines are 1.00 and 0.91 in (a) and 1.00 and 0.88 in (b) for sulphate and BC aerosols, respectively.

