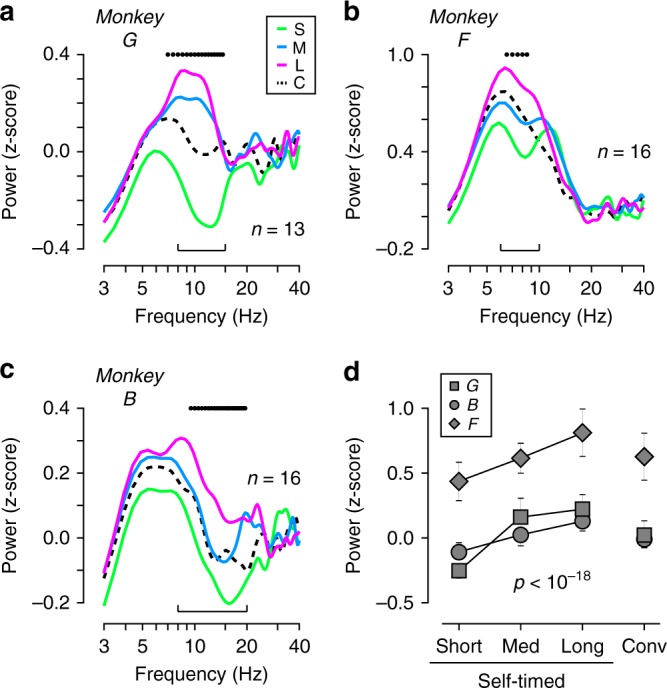
Fig. 5.

Spectral analysis of LFP during the pre-cue period. a–c Power spectra for monkeys G (a, n = 13 sites), F (b, n = 16), and B (c, n = 16). On each panel, black dots above the traces represent a significant difference across the interval conditions (one-way factorial ANOVA, 2 Hz bin with 0.5 Hz step, p < 0.01, see Methods). Brackets denote the frequency bands used for further quantification. d Comparison of the powers of low-frequency components. Different symbols denote different animals. Error bars indicate 95% CIs. The LFP power differed significantly across the interval conditions (repeated measures ANOVA, F2,88 = 71.5, p < 10−18)
