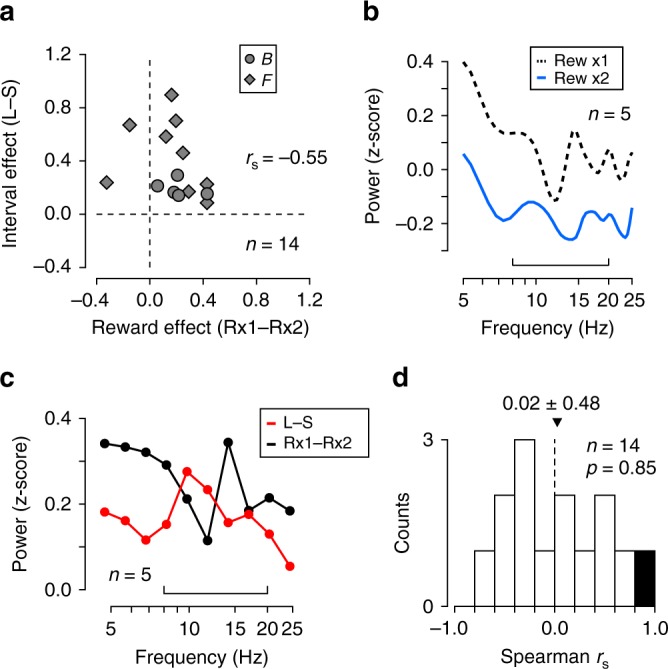
Fig. 6.

Effects of reward amount on the striatal LFP. a Comparison between the effects of reward amount and delay interval. Each point represents single site and compares the alteration in power at the low-frequency bands indicated by brackets in Fig. 5b, c. b Effects of reward amount for a broader frequency band in monkey B (n = 5 sites). The bracket indicates the frequency band used for the analysis in a. c Comparison of spectral modulation associated with interval condition (red, Long minus Short) with that associated with reward amount (black, Reward × 2 minus × 1). Data were divided into 10 groups. d Distribution of rank correlation coefficients computed for the two power spectra shown in c for individual sites in two monkeys. The black bar indicates statistically significant correlation (p < 0.05). Overall, the values were not statistically different from zero (two-tailed t-test, t13 = 0.19, p = 0.85)
