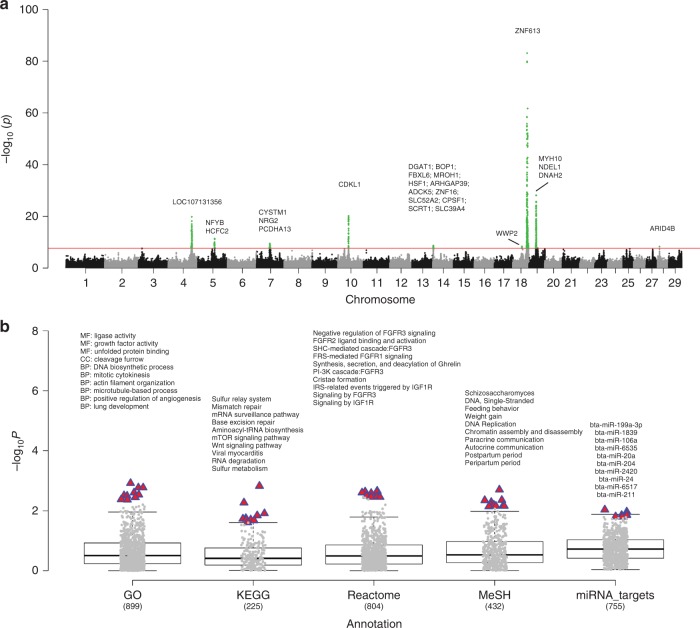
Fig. 1.
Single-marker GWAS, gene-level fine-mapping, and GWAS signal enrichment of gestation length. a Manhattan plot of all the imputed sequence variants being tested. Red line denotes the genome-wide significance of P equals to 1.91e-08. All the candidate genes are determined with the posterior probability of causality >0.05 based on gene-level fine mapping (BFMAP). b GWAS signal enrichment on the basis of five gene annotation sources, including Gene Ontology (GO), Kyoto Encyclopedia of Genes and Genomes (KEGG) pathway, Reactome metabolism pathway, Medical Subject Headings (MeSH), and miRNA-target networks. The values at x axis are the number of genomic features (i.e., gene lists) being tested in the corresponding annotation sources. The red triangle denotes the top 10 items with the highest enrichments (i.e., −log10P) in each annotation source. The names of these items are shown in the figure

