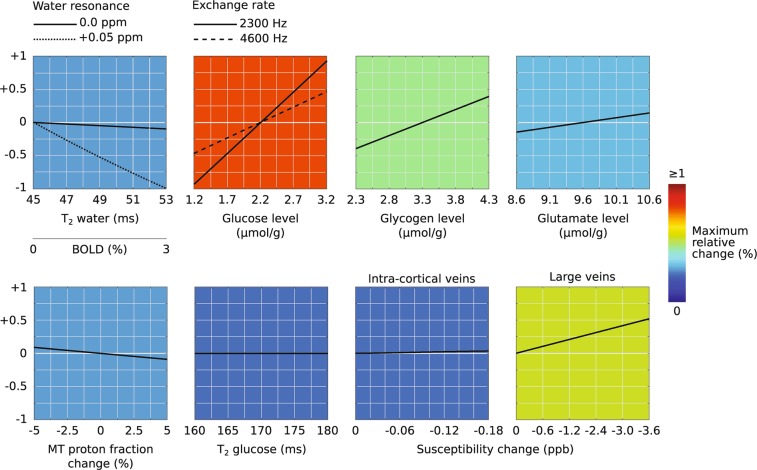
Figure 1.
Functional CEST simulation results. The expected CEST-fMRI contrasts for the acquisition and reconstruction strategy adopted in this study, based on S(−1.2 ppm)/S(+1.2 ppm) signal ratio calculations plotted along the y-axis, are correlated against various potential variables: water T2*, glucose concentration, glycogen concentration, glutamate concentration, MT effects, glucose T2 and susceptibility changes. The colors were chosen according to the maximum expected relative changes (shown in %); note that a change in glucose’s exchange rate will also affect the obtained contrasts.

