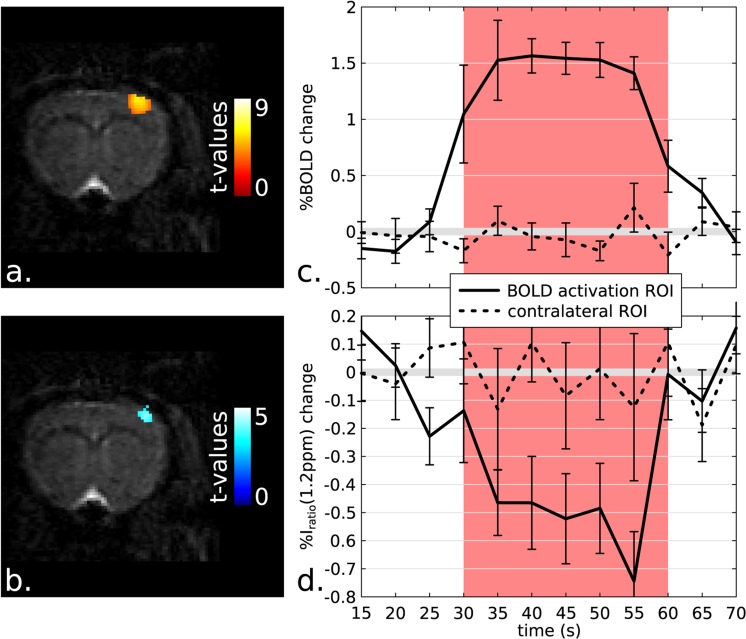
Figure 2.
BOLD vs glucoCEST fMRI maps and time evolutions. Typical BOLD (a) and glucoCEST-fMRI maps (b) acquired on a rat subject to a 30 s on/off electrical forepaw stimulation at 17.2 T. Images were processed in SPM and displayed with a p-value threshold of 0.001. A local decrease of the image ratio Iratio(1.2 ppm) was detected during stimulation; notice its coincidence with the BOLD activation ROI. (c) BOLD and (d) glucoCEST-fMRI group mean time courses (n = 5 animals, 9 independent data sets). All time courses are showing relative changes compared to the baseline resting state (which was set at 0%). A substantial −0.5% relative decrease is observed for Iratio(1.2 ppm) during activation. As controls, time courses were extracted from the contra-lateral ROIs and these never revealed any significant changes (dashed lines). Note that the BOLD time evolution was extracted from the CEST-weighted images. The error bars represent the standard error of the mean (SEM) obtained over the n animals included in the group study.

