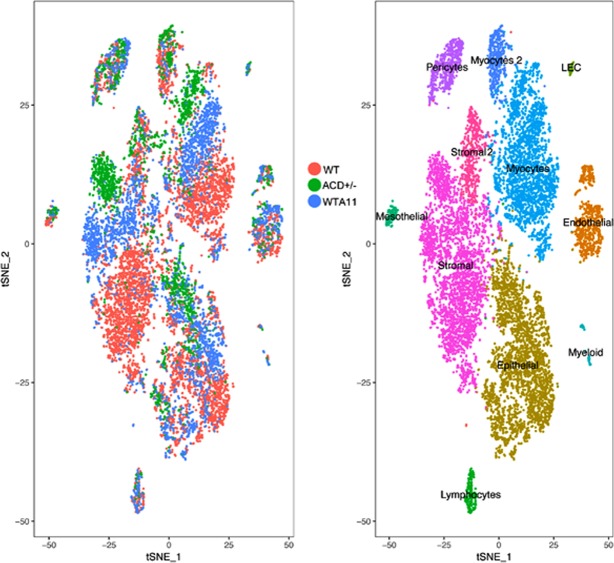
Figure 8.
Comparison of WT, ACD+/− and ACD+/−WTA11 cells. Cells of all three genotypes were combined for unsupervised clustering analysis. Right panel shows t-SNE plot color coded according to resulting cells types, as labeled. Left panel shows the same t-SNE only color coded according to genotype. Of interest, the two cells types, stromal and myocyte, with strongest expression of the mutated Hox genes show very distinct cell separations based on genotype. For example, the stromal cluster includes ACD+/− cells grouping at the top, WT cells at the bottom, and ACD+/−WTA11 cells in between. Myocytes show a very similar separation. Other cell types, such as endothelial, and lymphocytes, with little expression of the Hox genes mutated, show no such separation based on genotype, arguing against a simple batch effect explanation.

