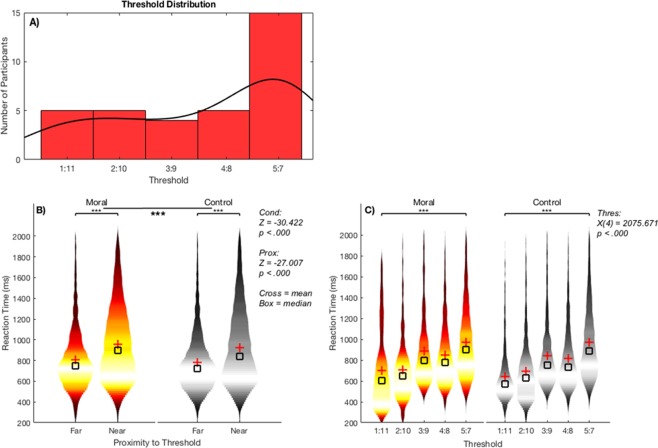
Figure 2.
Threshold distribution and reaction time comparison between Moral and Control blocks in all trials. (A) Distribution of thresholds of all participants. There was a roughly even distribution of participants in the lowest four thresholds, while the highest threshold, 5:7, contained the largest number. (B) All trials in two Wilcoxon signed-rank tests measuring the effect of condition (Moral, Control) and proximity to threshold (Near, Far) on reaction time. There was a significant effect of both condition and proximity (Z- and p-values stated). (C) All trials in a Kruskal-Wallis H test (5 levels) measuring the effect of threshold (1:11, 2:10, 3:9, 4:8, 5:7) on reaction time. Box = median, Cross = mean.

