
Figure 6.
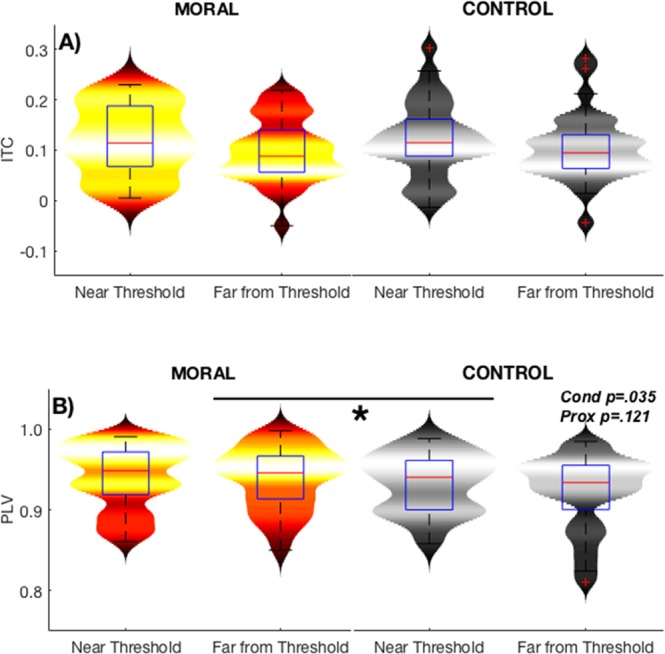
Intertrial coherence (ITC) and theta phase-locking value (PLV). (A) A subset of ITC data, from 3–5 Hz and between 0–100 ms for both conditions and both proximities to threshold. This is for illustration of the data distribution only, therefore there are no statistics here as they were done previously in Fig. 5. (B) Theta (4–7 Hz) PLV for the whole epoch (0–2000 ms) in both conditions and both proximities to threshold. In the Theta band, there was a significant effect of condition (p-value stated) but not of proximity to threshold.