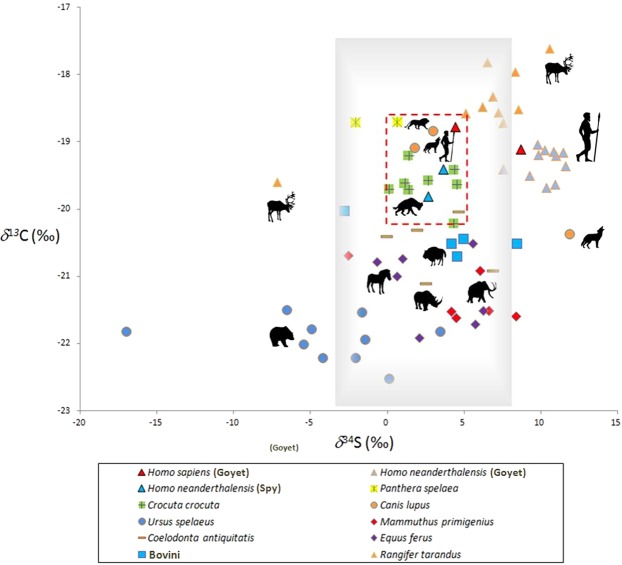
Figure 2.
Bivariate plot of δ34S and δ13C stable isotopic values of bone collagen representing the Late Pleistocene ecosystem in Belgium. The plot includes Neandertals as well as UPMHs from Goyet and Neandertals from Spy. Faunal remains are from Scladina, Spy and Goyet. Different species are associated with different symbols and colors. Individual specimens are plotted. The shaded grey rectangle represents the local sulphur signal, the red dashed line essentially encompasses most of the carnivorous species. Carnivores reflect the average δ34S values of their prey75.

