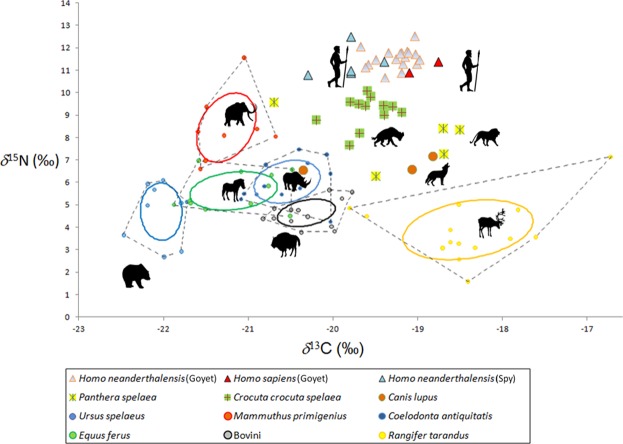
Figure 4.
Bivariate plot of δ13C and δ15N stable isotopic values of bone collagen, representing the Late Pleistocene ecosystem from Scladina, Spy and Goyet in Belgium. The plot includes Neandertals and UPMHs from Goyet as well as Neandertals from Spy. Herbivores’ core niches (= standard ellipse areas) in total niche (dashed convex hulls) were calculated using SIBER86 (Stable Isotope Bayesian Ellipses in R). Omnivores and carnivores are displayed as individual specimens. Silhouettes represent species attribution. The same silhouette is used to represent Neandertals and UPMHs.

