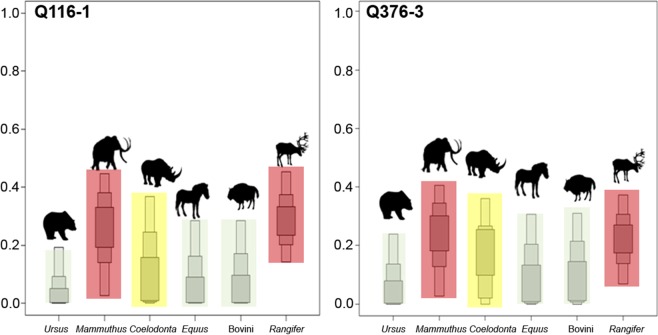
Figure 5.
Box plots of the relative contributions (in %) of different prey species to the protein portion of the diet of the UPMHs from Goyet. Calculations were performed through the application of a Bayesian method (SIAR V4, Stable Isotope Analysis-package in R)87,88. Within the proportion box plots, three shades of grey are shown. Light grey represents a probability of 95%, medium grey 75% and dark grey 25%. Background colors highlight relative importance with red: most important, yellow: second most important and bright green: least important for a single species. The relative contributions of each species are similar for both individuals (Q116-1 and Q376-3). Here, faunal remains from the sites of Goyet, Scladina and Spy are included Table S1).

