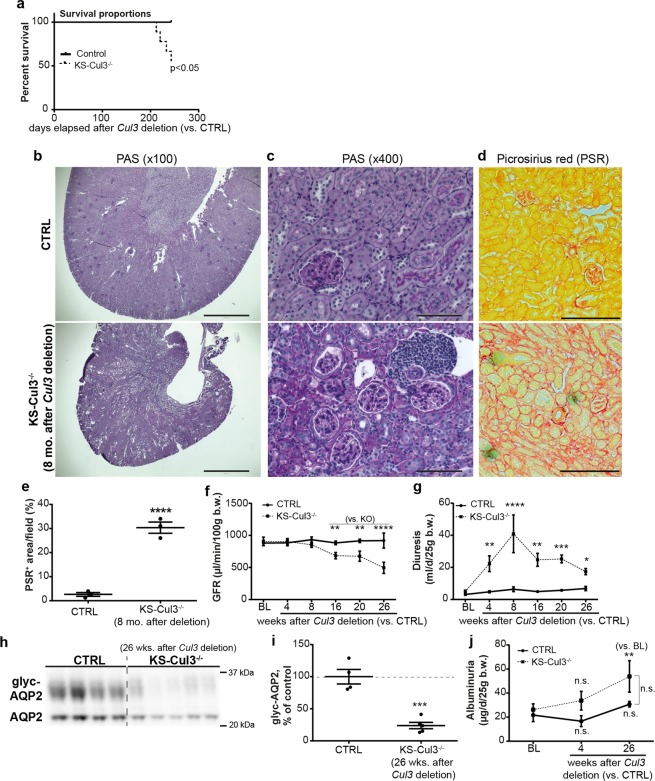
Figure 6.
Cul3 disruption caused death from progressive kidney fibrosis. (a) Kidney-specific Cullin 3 knockout (KS-Cul3−/−) mice (3 females, one male) spontaneously died 7–8 months after Cul3 disruption (8 CTRL vs. 9 KS-Cul3−/− mice; log rank test; experiment was stopped after 4 deaths and samples were obtained from remaining mice for further analysis). (b,c) Periodic acid-Schiff staining of kidney tissue from remainder of (a) revealed kidney atrophy, cell infiltration, tubule dilation, epithelial simplification and interstitial expansion. Scale bars = 1000 μm (b) and 100 μm (c–e) Picrosirius red staining (PSR) revealed increased collagen deposition. Scale bars = 200 μm. (f) Measurement of glomerular filtration rate (GFR) with fluorescence-labeled sinistrin-administration and its transcutaneous detection showed progressive decline of kidney function after 16 weeks of Cul3 deletion. (g–i) Cul3 deletion caused decreased abundance of AQP2 and polyuria peaked at 8 weeks, but then despite low AQP2 levels diuresis declined, likely due to renal failure. (j) Albumin excretion was not significantly different between control and KS-Cul3−/− mice. Mean values are shown ± SEM. Asterisks show significant differences between control and KS-Cul3−/− mice at given time point obtained by unpaired t-test (n = 4–5). *P ≤ 0.05, **P ≤ 0.01, ***P ≤ 0.001, ****P ≤ 0.0001; Abbreviations: n.s., not significant; glyc, glycosylated; BL, baseline; b.w., bodyweight. Coomassie-stained gels used for Western blot normalization can be found in Supplementary Fig. S4. Western blots were cropped for clarity; uncropped images can be found in Supplementary Fig. S9.

