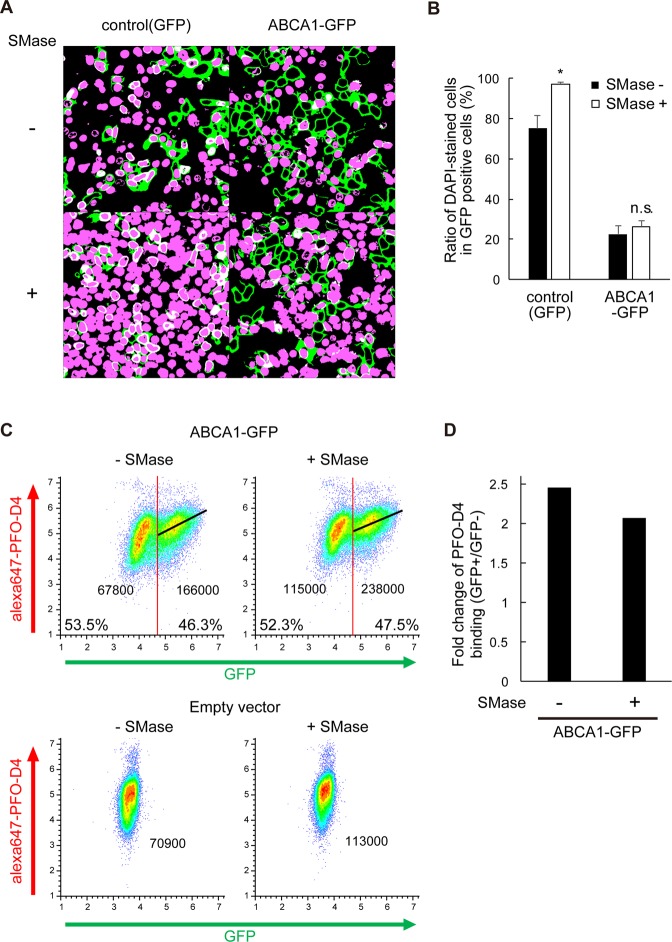
Figure 5.
SMase treatment increases SLO pore formation in control cells, but not in ABCA1-expressing cells. (A) HEK293 cells transiently transfected with plasmids for GFP and ABCA1-GFP were treated with SMase just before the treatment with SLO and DAPI (original images are shown in Supplementary Fig. 2). (B) DAPI-stained and -unstained GFP-positive cells were counted, and proportions were calculated. Filled bars, before SMase treatment; empty bars, after SMase treatment. Average values are shown with S.E. For each sample, images were acquired at five positions in the dish. *P < 0.01 compared with SMase-untreated. n.s. P > 0.05 compared with control (GFP). (C) FreeStyle293-F cells transiently transfected with plasmids encoding ABCA1-GFP or control empty vector were treated with SMase just before flow cytometry analysis. Cells with fluorescence intensity greater than 50,000 were defined as GFP-positive, and others as GFP-negative. Linear regression between GFP and Alexa Fluor 647 is shown as a black line. The median value of Alexa Fluor 647 fluorescence intensity of each population is shown. (D) Fold change in the median value of Alexa Fluor 647 fluorescence intensity in GFP-positive vs. GFP-negative cells.

