Fig. 1.
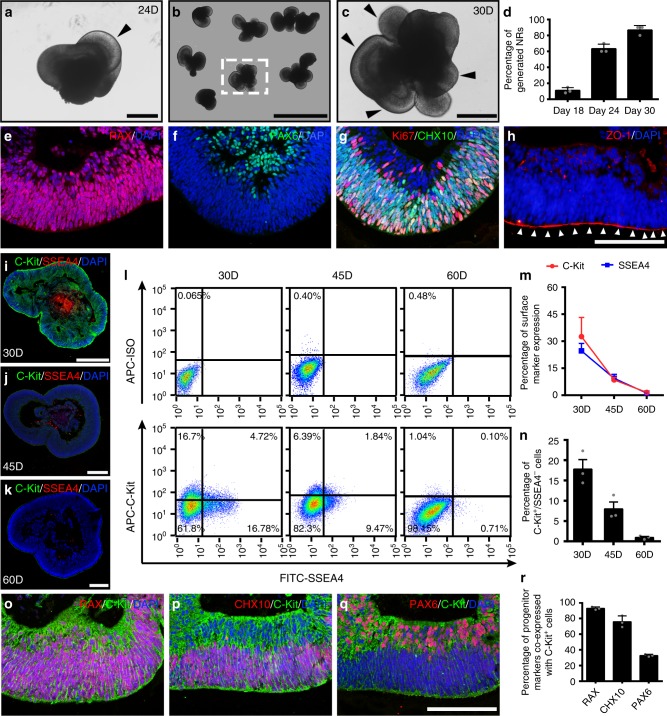
Identification and C-Kit/SSEA4 expression in hEROs. a Induction of the 24-day neural retina structure (black arrowhead). b Induction of the 30-day neural retina. c Magnification of the neural retina (black arrowheads) shown in b. d Quantitative analysis showing that the number of generated neural retinas increased with induction time (18-day: 11.1 ± 1.2%; 24-day: 63.3 ± 1.9%; 30-day: 86.7 ± 1.9%; n = 3 independent experiments/group; each experiment containing 96 hEROs.). e–g Expression of the RPC markers RAX, PAX6, and CHX10 and the proliferation marker Ki67 in hEROs. h Identification of the apical side of hEROs on day 30 via ZO-1 staining. i–k Distribution of C-Kit and SSEA4 antigens in 30-day, 45-day, and 60-day hEROs. l Flow cytometry analysis of C-Kit and SSEA4 expression in hEROs at different induction times (30-day, 45-day, and 60-day). m Statistical analysis of C-Kit and SSEA4 expression in hEROs (C-Kit: 30-day: 32.60 ± 10.58%; 45-day: 8.53 ± 1.36%; 60-day: 1.58 ± 0.45%; SSEA-4: 30-day: 24.6 ± 4.16%; 45-day: 9.35 ± 2.23%; 60-day: 1.17 ± 0.88%, n = 3 independent experiments/group; each experiment containing 192 hEROs). n Percentage of C-Kit+/SSEA4− cells determined by flow cytometry analysis (30-day: 17.80 ± 4.06%; 45-day: 7.99 ± 2.96%; 60-day: 0.96 ± 0.42%; n = 3 independent experiments/group; each experiment containing 192 hEROs). o–q Co-expression of C-Kit and RPC markers in 30-day hEROs. r Quantitative analysis of RPC marker expression in C-Kit+/SSEA4− cells in 30-day hEROs (RAX: 92.86 ± 1.88%; CHX10: 75.79 ± 7.46%; PAX6: 32.74 ± 1.58%; n = 3 independent experiments/group; each experiment containing 3 hEROs). Data are presented as mean ± SD. Scale bars, 200 μm (a, c, i–k), 1 mm (b), 50 μm (e–h, o–q). hEROs hESC-derived retinal organoids

