Fig. 4.
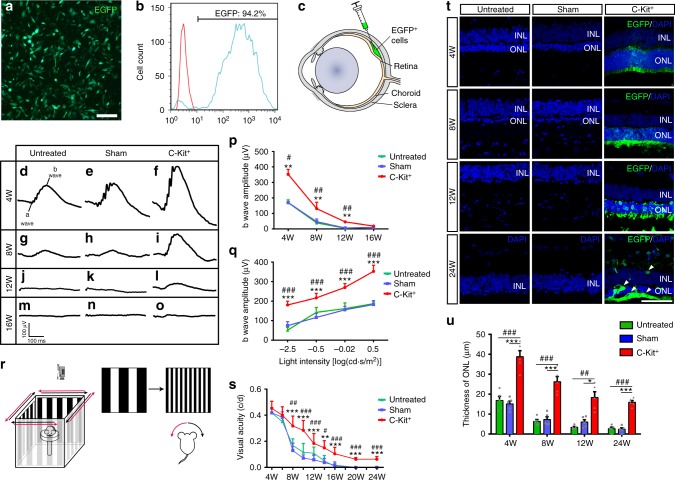
Protective effect of grafted C-Kit+ cells on RCS rats. a Identification of P3 EGFP hERO-derived cells transduced with lentivirus. b Flow cytometry analysis showing the EGFP+ rate of P3 hERO-derived cells. c Diagram showing the subretinal transplantation. d–o Representative b-waves of the C-Kit+, sham, and untreated groups at PO 4w, 8w, 12w, and 16w measured through scotopic flash electroretinography (fERG) at 0.5 log(cd*s/m2). p Statistical analysis of the amplitudes of ERG b-waves at 0.5 log(cd*s/m2) in the three groups from PO 4–16w. n = 5 eyes/group. q ERG b-waves of different light intensity stimuli at PO 4w. n = 5 eyes/group. r Diagram showing the setup of the optokinetic response test. s Visual acuity analysis obtained through the optokinetic response test at various post-operational times up to 24 weeks. n = 6 eyes/group. t Representative images of the ONL in the three groups from PO 4–24w. EGFP+ cells showing surviving cells at PO 24w (white arrowheads). u Statistical analysis of ONL thickness in the three groups at four time points (n = 5 eyes/group). P values were determined by one-way analysis of variance (ANOVA) test followed by Tukey (equal variances) or Dunnett’s T3 (unequal variances) multiple comparison tests p, q, s, u C-Kit+ cells vs Sham: *P < 0.05, **P < 0.01, ***P < 0.001; C-Kit+ cells vs Untreated: #P < 0.05, ##P < 0.01, ###P < 0.001. Data are presented as mean ± SEM. Scale bars, 100 μm (a), 50 μm (t). ONL outer nuclear layer, INL inner nuclear layer

