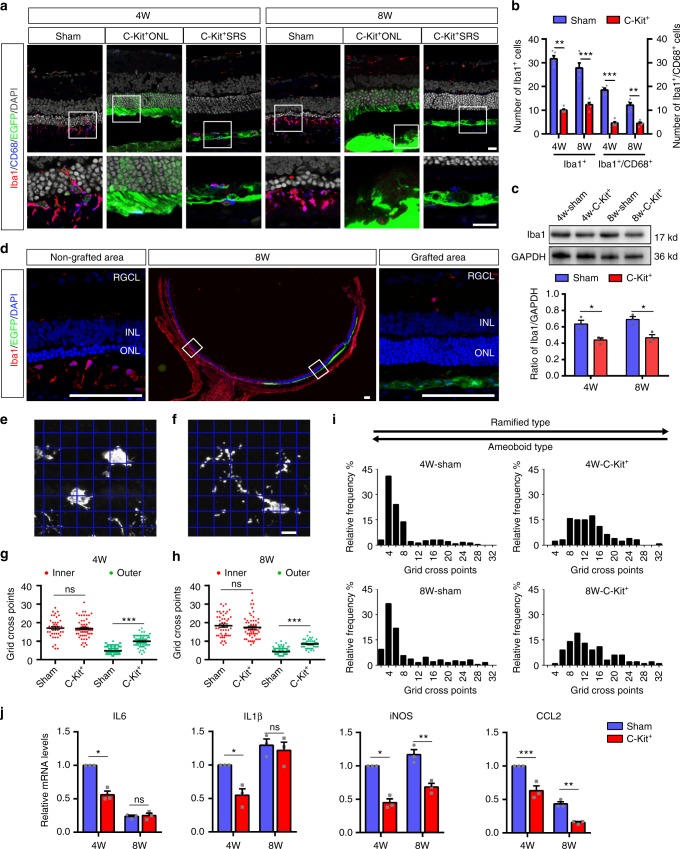
Fig. 6.
Microglial suppression of RCS rats through grafted C-Kit+ cells. a Iba1 and CD68 staining in the C-Kit+ cell group (showing EGFP+ cells extended to the ONL (C-Kit+ONL) or only in the SRS (C-Kit+SRS)) and the sham group at PO 4w and 8w. b Statistical analysis of the number of Iba1+ microglial cells and Iba1+/CD68+phagocytic microglial cells counted in confocal images (n = 5 eyes/group). c Western blot analysis of Iba1 protein level (n = 3 eyes/group). d Whole retinal section image showing Iba1 staining in the non-grafted area and the grafted area at PO 8w. e, f Representative images of ameboid-like (e) and ramified microglia (f) analyzed by grid crossing. g, h Statistical analysis of the grid-crossing points in each microglial cell in the inner retina (including RGCL, IPL, INL, and OPL) and the outer retina (including ONL and SRS) of sham and C-Kit+ cell-transplanted RCS rats at PO 4w and 8w. i Histogram showing the distribution of grid-crossing points per individual microglial cell in retina at PO 4w and 8w. Microglial cells from at least three eyes per group, n = 233 cells for 4w-Sham group, n = 127 cells for 4w-C-Kit+ group, n = 192 cells for 8w-Sham group, n = 100 cells for 8w-C-Kit+ group. j Real-time qPCR analysis showing relative mRNA expression for the inflammatory factors IL6, IL1β, iNOS, and CCL2 in the retinas of the C-Kit+ and sham groups. (n = 3 eyes/group). P values were determined by unpaired two-tailed Student’s t-test (b, c, g, h, j) *P < 0.05; **P < 0.01; ***P < 0.001; ns, not significant. Data are presented as mean ± SEM. Scale bars, 20 μm (a), 100 μm (d), 7 μm (e, f). GCL ganglion cell layer, IPL inner plexiform layer, INL inner nuclear layer, OPL outer plexiform layer, SRS subretinal space, IL6 interleukin-6, IL1β interleukin-1-beta, iNOS inducible nitric oxide synthase, CCL2 chemokine (C-C motif) ligand 2

