Fig. 8.
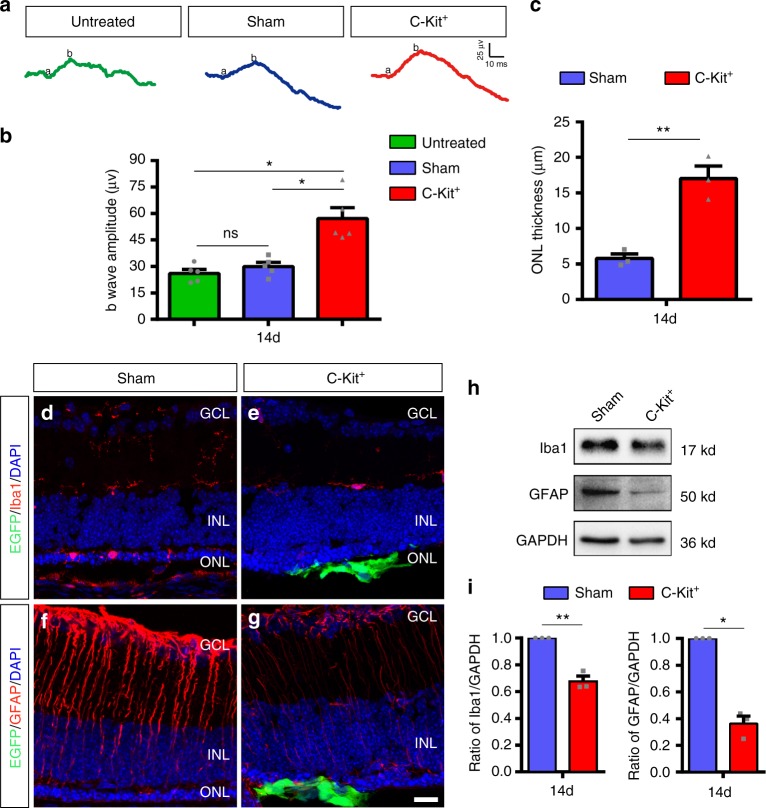
Improvement of retinal function and microenvironment by C-Kit+ cell in rd1 mice. a Representative b-waves of the C-Kit+, sham, and untreated groups of rd1 mice at PO 14d. b Statistical analysis of the amplitude of ERG b-waves in the C-Kit+, sham, and untreated groups at PO 14d (n = 5 eyes/group). c Statistical analysis of ONL thickness at PO 14d (n = 3 eyes/group). d, e Iba1 staining at PO 14d. f, g GFAP staining at PO 14d. Scale bar, 20 μm. h, i Western blot analysis of Iba1 and GFAP protein levels (n = 3 eyes/group). P values were determined by one-way ANOVA followed by Dunnett’s T3 multiple comparison tests (b) *P < 0.05; **P < 0.01; ***P < 0.001, ns not significant. P values were determined by unpaired two-tailed Student’s t-test (c, i) *P < 0.05; **P < 0.01; ***P < 0.001. Data are presented as mean ± SEM

