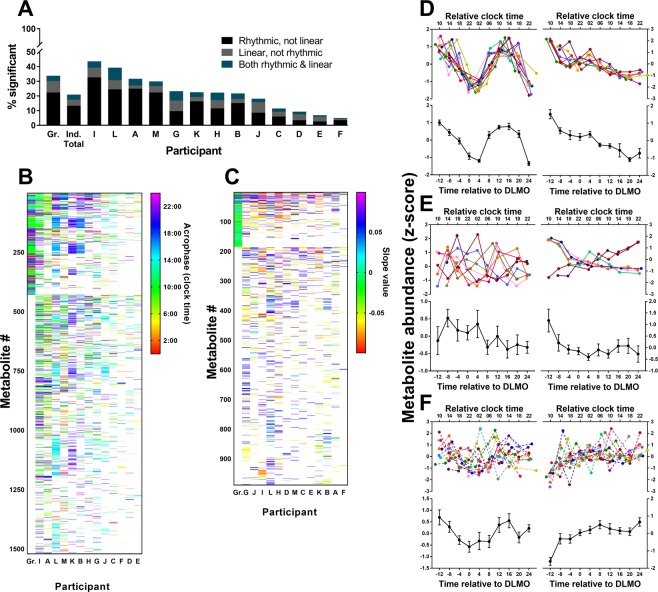
Figure 4.
Comparison of group- versus individual-level analyses. (A) The percentage of metabolites that were significantly rhythmic (black), linear (grey), or combined rhythmic and linear (blue) at the group-level (Gr.), overall for the individual-level analysis (Ind. total), and for each individual participant (A–M). (B) Acrophase and (C) slope values are shown for significant metabolites (including combined rhythmic and linear metabolites) at the group-level (Gr.) and in individual participants (A–M). Metabolites are ordered based on the number of significant cosinor or linear fits across participants, with group-significant metabolites shown first. Participants are ordered from left to right based on the greatest number of significantly rhythmic or linear metabolites at the individual-level. (D) Metabolites that were significantly rhythmic (left) or linear (right) in group- and individual-level analyses. (E) Metabolites significantly rhythmic (left) or linear (right) in almost half of individuals but were not group-significant. (F) Metabolites that were significantly rhythmic (left) or linear (right) in group-level, but not individual-level analyses (non-significance denoted by broken lines in individual-level plots). Individual participant profiles are shown in colour and the group mean (±SEM) for that metabolite is shown below in black.

