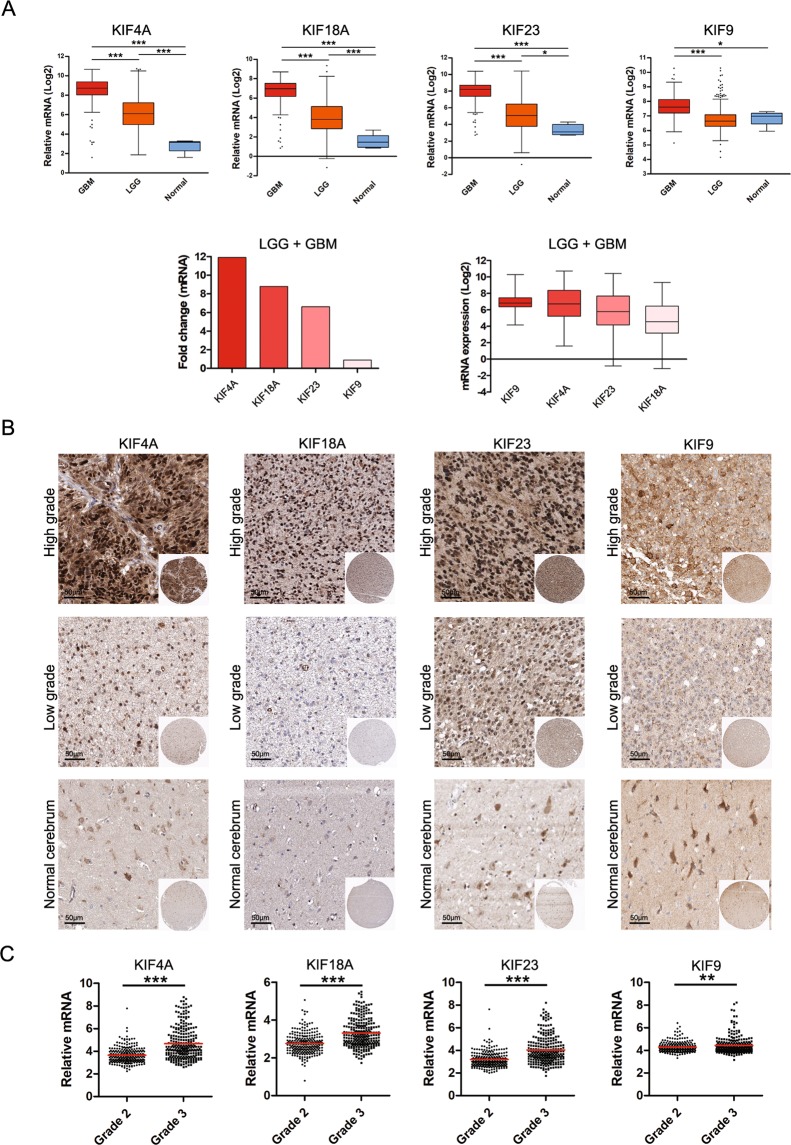
Figure 1.
mRNA and protein expression of KIF4A, 9, 18A, and 23 in LGG and GBM. (A) The relative mRNA expression of KIF4A, 9, 18A, and 23 was compared among the normal control, LGG, and GBM (upper). The mRNA expression of KIF4A, 9, 18A, and 23 in LGG and GBM merged dataset was compared with that in normal samples in the TCGA dataset (lower). The fold change values of KIF4A, 9, 18A, and 23 were 11.9, 0.9, 8.8, and 6.6, respectively (lower left). The relative mRNA expression of KIF4A, 9, 18A, and 23 was compared in LGG and GBM merged dataset (lower right). (B) Representative IHC images of KIF4A, 9, 18A, and 23 in normal cerebrum, low-grade glioma, and high-grade glioma in Human Protein Atlas. Image available from v18.proteinatlas.org18–20. The scale bar indicates 50 µm. (C) Comparison of the mRNA expression of KIF4A, 9, 18A, and 23 in LGG between histologic grades 2 and 3. The distribution was compared between the two groups by t-test. A p-value < 0.05 was deemed to indicate statistical significance. *p < 0.05, **p < 0.01, ***p < 0.001.

