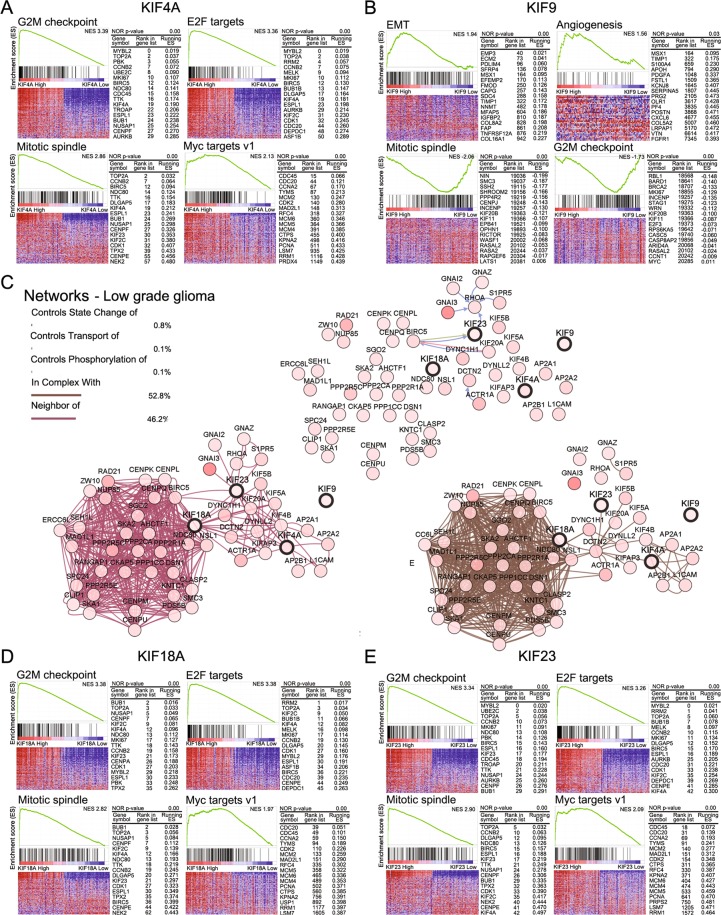
Figure 6.
Network analysis and GSEA based on hallmark gene sets in LGG. The graph displays the enrichment gene set based on the pathway-provided hallmark genes in the top 10% vs. bottom 10% groups of KIF4A, 9, 18A, and 23 in LGG. (A,D,E) Pathways of the G2M checkpoint, E2F targets, mitotic spindle, and Myc targets v1 were increased in the high KIF4A, 18A, and 23 groups, which showed adverse effects on prognosis. (B) Pathways of EMT and angiogenesis were increased, and pathways of the mitotic spindle and G2M checkpoint were decreased in the high-KIF9 groups. (C) Network analysis of KIF4A, 9, 18A, and 23 in LGG was performed in cBioportal (http://www.cbioportal.org/)21,22. Each gene in the network is marked with a circle. Linkages related to state change, transport, phosphorylation, complex, neighbor among genes were connected by color lines.

