Figure 1.
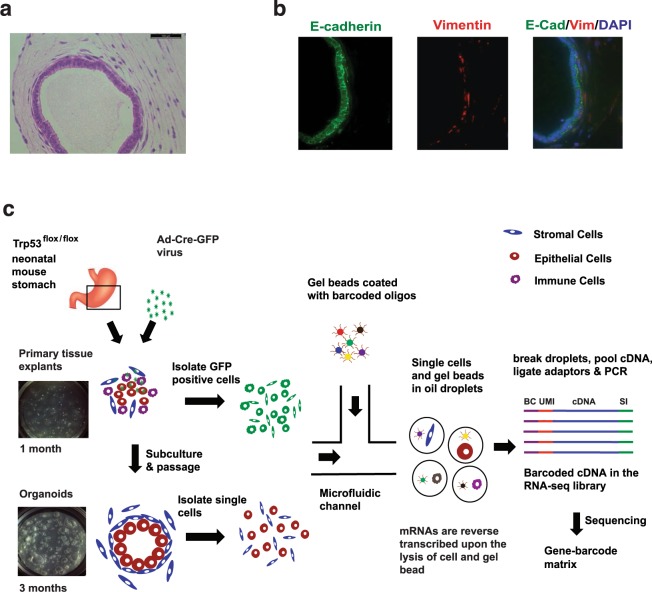
Analysis of gastric organoid populations with immunofluorescence and single cell RNA-Seq. (a) H&E staining shows that the Trp53−/− organoid, cultured for three months, consist a layer of tall columnar epithelial cells with an outer lining of spindle-shaped fibroblastic stroma cells. (b) The IF showed that E-cadherin (E-cad) is expressed in epithelial cell layer (green) and Vimentin (Vim) is expressed in surrounding fibroblast cells (red). Nuclei are counterstained with DAPI (blue). (c) Overview of dissecting cell population using single cell RNA sequencing (scRNA-Seq). Individual cells were encapsulated with single gel beads coated with oligonucleotides in droplet partitions via a high throughput microfluidic device. mRNAs were reverse transcribed by the barcoded oligonucleotides in individual droplets. Subsequently, the droplets were broken and barcoded cDNAs were pooled together for PCR amplification to generate complete scRNA-Seq libraries for sequencing. BC - Barcode, UMI - Unique Molecular Identifier, SI - Sample Index.

