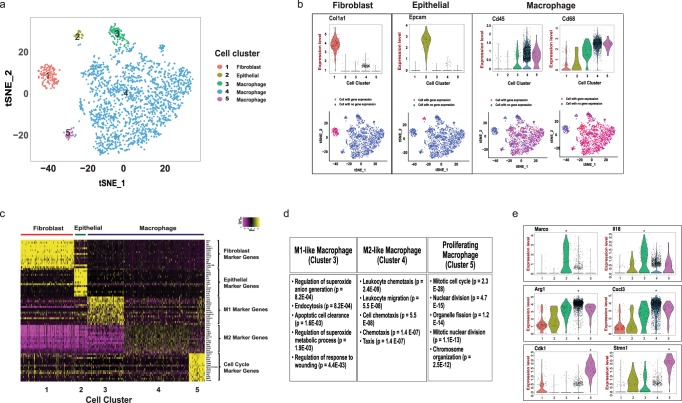
Figure 2.
Distinct cell types in the tissue explants. (a) A tSNE projection of 2,232 cells from tissue explants. Cells are grouped into five clusters based on transcriptome profiles and are colored accordingly. The cell type assignment of each cluster is based on the gene expression analysis. (b) The expression of cluster specific genes, i.e., Col1a1, Epcam, Cd45, Cd68, are displayed on violin plots and tSNE maps. (c) Heatmap shows the expression of top 15 cluster specific genes in 200 cells (or less) from each cluster. Yellow - high expression. Purple - low/no expression. Each row represents a gene, and each column represents a single cell. (d) The top five GO biological processes in macrophage clusters based on the gene enrichment analysis. Top 50 genes in each cluster were included in the analysis. p value was calculated with the Fisher’s Exact Test and adjusted by the Bonferroni correction24. (e) The violin plots of macrophage group specific genes, i.e., Marco, IL18, Arg1, Cxcl3, Cdk1, Stmn1. Every dot represents an individual cell in both violin plots and tSNE maps. The gene expression level is the natural log of the normalized UMI counts in the violin plot. *Bonferroni adjusted p value < 0.001.

