
Figure 5.
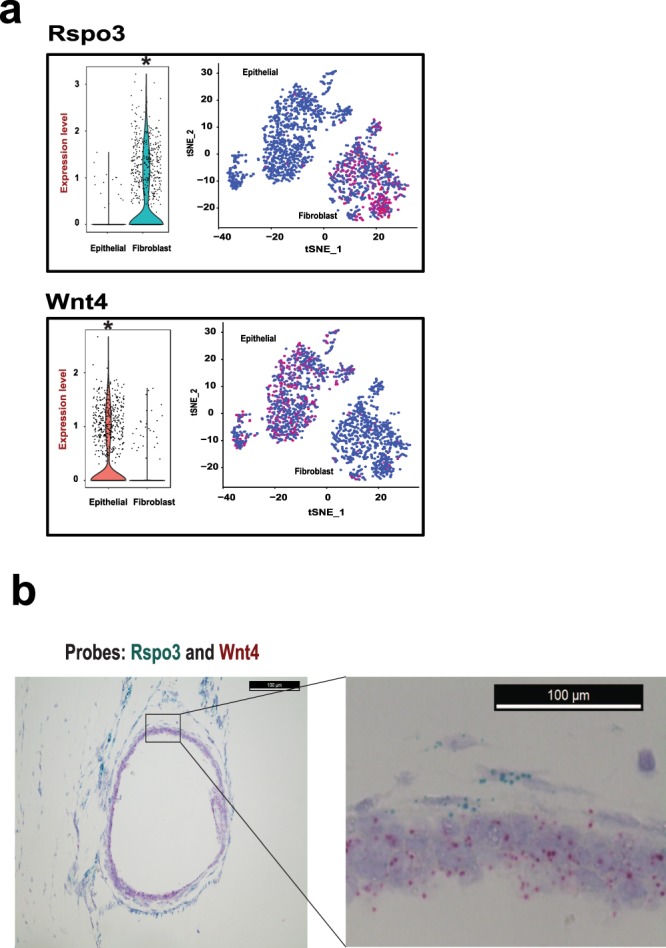
Cell type specific expression of Rspo3 and Wnt4. (a) Cell type specific expression of Wnt ligands. The violin and tSNE plots depict that Rspo3 mRNA expression is enriched in the fibroblast cells and Wnt4 mRNA expression is enriched in the epithelial cells. The expression level of violin plot is the natural log of the normalized UMI counts. *Bonferroni adjusted p value < 0.001. (b) RNA In situ hybridization confirms cell type specific expression of Rspo3 and Wnt4 in the organoid. The organoid FFPE section is hybridized and amplified by the probes specifically targeting Rspo3 and Wnt4 mRNAs. Rspo3 probes are the blue dots detected in the fibroblast cells surrounding the organoid, and Wnt4 probes are the red dots detected in the epithelial cells forming the wall of the organoid sphere (Scale bar = 100uM).