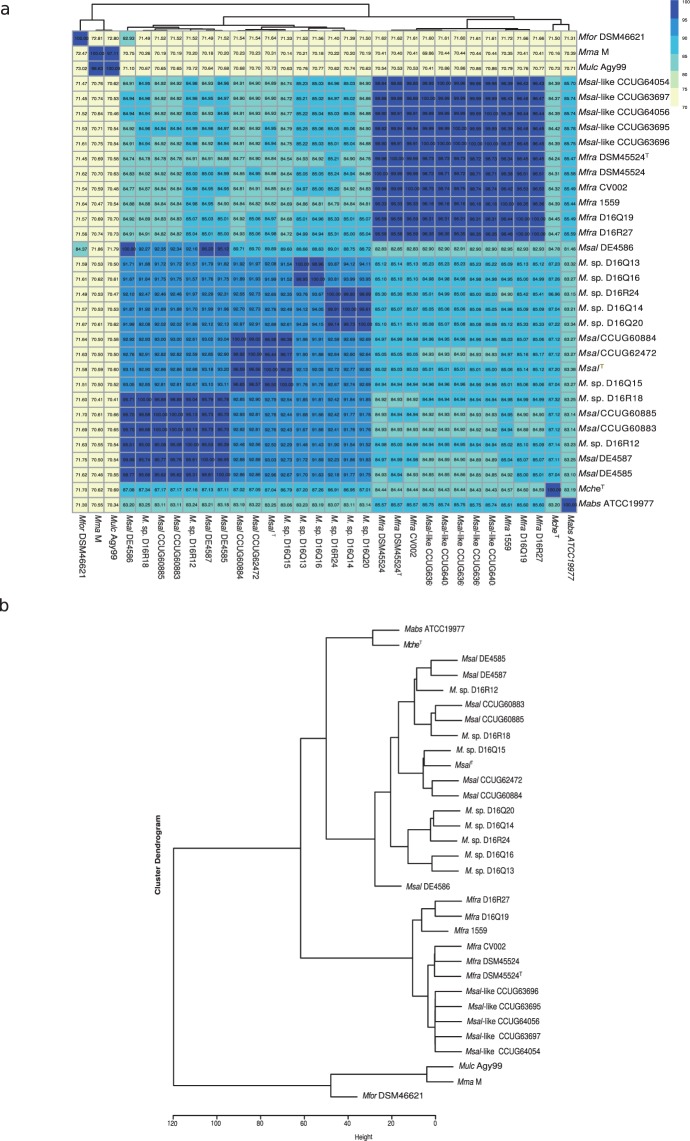
Figure 2.
Clustering of Msal, Msal-like and other MCAC-members based on the average nucleotide scores (ANI) as indicated. (a) Heat map showing ANI values for ‘all-versus-all’ Msal and Msal-like strains including other members of the MCAC. ANI values were clustered based on unsupervised hierarchical clustering (see Methods). The horizontal tree represents the heatmap clustering of column wise dendogram. (b) Dendogram, extracted from the heat map in (a), showing clustering of different strains/isolates based on ANI values.

