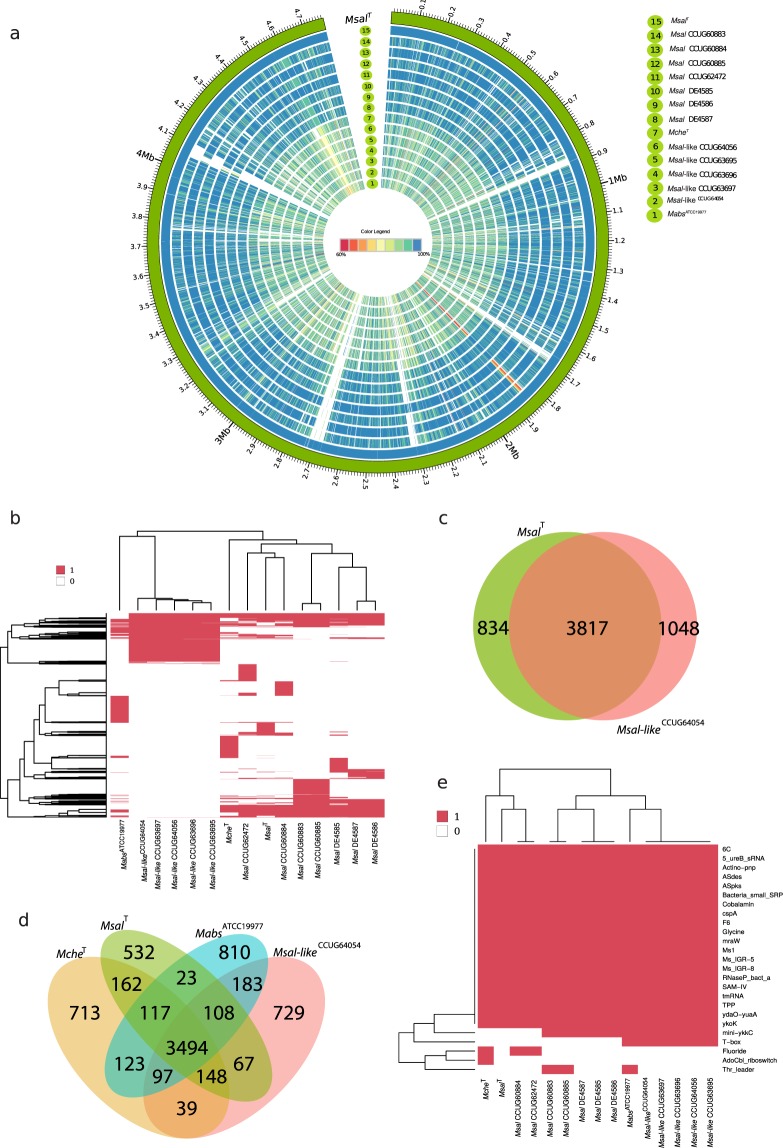
Figure 3.
Comparative analysis of orthologous genes predicted to be present in Msal and Msal-like strains, McheT and MabsATCC19977. (a) Circos plot showing the presence of protein coding genes in seven Msal, five Msal-like strains, McheT and MabsATCC19977 compared to the reference genome MsalT. The outer track (green) represents the genome for MsalT with a size scale, while the next circle in blue corresponds to the predicted protein coding sequences (CDS) for MsalT. Subsequent circular tracks represent one genome and the number corresponds to the strain name in the legend on the right. Colored radial blocks represent orthologous genes in the corresponding genome and color intensity (see color scale in the middle) indicates percentage identity at the protein level. The white blocks indicate that no orthologs were identified. (b) Heat map showing presence (red) and absence (white) of orthologous genes (excluding core genes) mapped in different Msal and Msal-like strains, McheT and MabsATCC19977, and clustered using hierarchical clustering. The horizontal and vertical trees represent the heat map clustering of the column and row wise dendograms. (c) Venn diagram showing common and unique coding genes for Msal and Msal-like representative strains as indicated. (d) Venn diagram showing common and unique genes in MsalT, Msal-likeCCUG64054, McheT and MabsATCC19977. (e) Heat map showing presence (red) and absence (white) of orthologous ncRNA genes mapped as in (b). The ncRNA genes were identified using Rfam, see main text. The horizontal and vertical trees represent the heat map clustering of the column and row wise dendograms.

