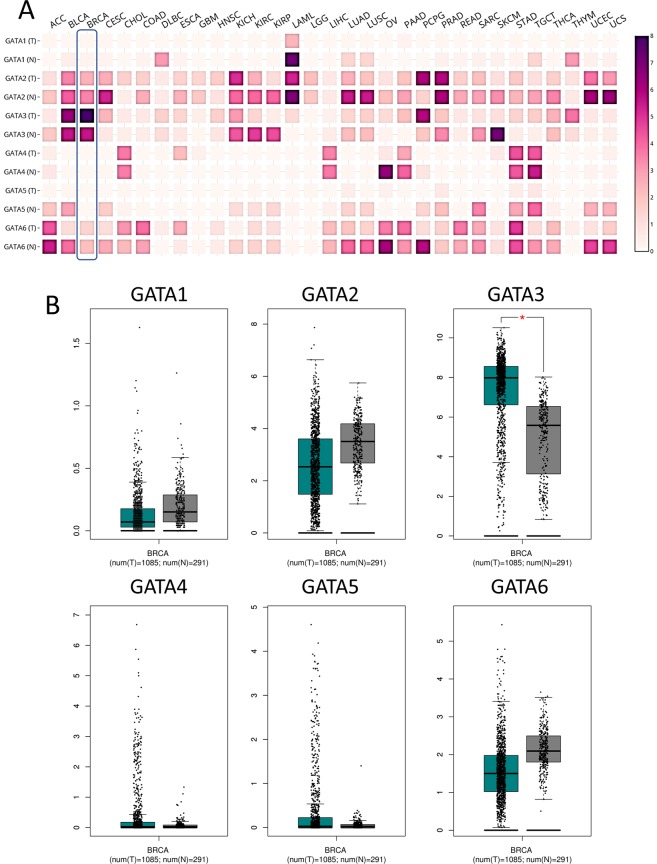
Figure 2.
The RNA-Seq profile of the GATA family members in the pan-cancer analysis. (A) The heatmap indicates the expression after normalization by log2(TPM + 1) for log-scale compared with tumor and normal tissues in pan-cancer. The cancer abbreviation names are shown according to TCGA study abbreviations. (B) Boxplot of the expression profile of the GATA family members in breast cancer. A t-test was used to compare the expression difference between tumor and normal tissues.

