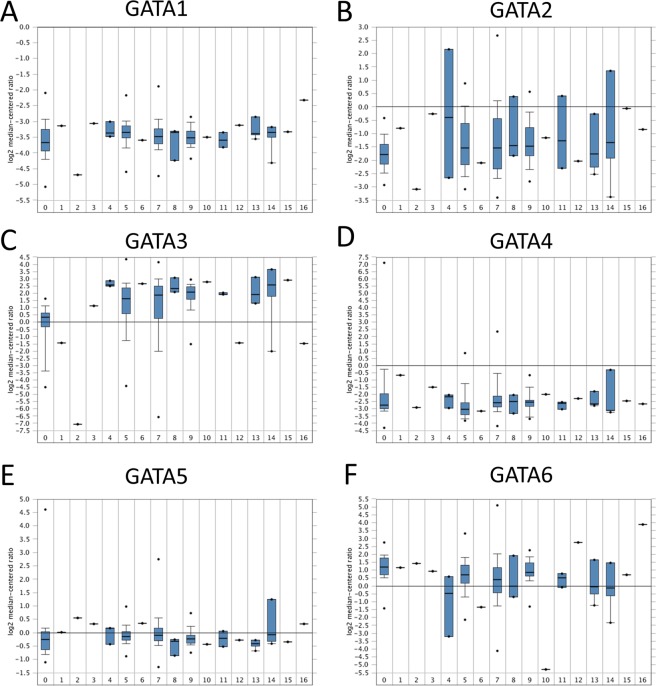
Figure 3.
Box plots representing the mRNA expression levels of the GATA family genes in different types of breast cancer and normal controls in the TCGA database. 0 = Normal (61); 1 = Apocrine Breast Carcinoma (1); 2 = Breast Large Cell Neuroendocrine Carcinoma (1); 3 = Ductal Breast Carcinoma (1); 4 = Intraductal Cribriform Breast Adenocarcinoma (3); 5 = Invasive Breast Carcinoma (76); 6 = Invasive Cribriform Breast Carcinoma (1); 7 = Invasive Ductal Breast Carcinoma (392); 8 = Invasive Ductal and Lobular Carcinoma (3); 9 = Invasive Lobular Breast Carcinoma (36); 10 = Invasive Papillary Breast Carcinoma (1); 11 = Male Breast Carcinoma (3); 12 = Metaplastic Breast Carcinoma (1); 13 = Mixed Lobular and Ductal Breast Carcinoma (7); 14 = Mucinous Breast Carcinoma (4); 15 = Papillary Breast Carcinoma (1); and 16 = Pleomorphic Breast Carcinoma (1).

