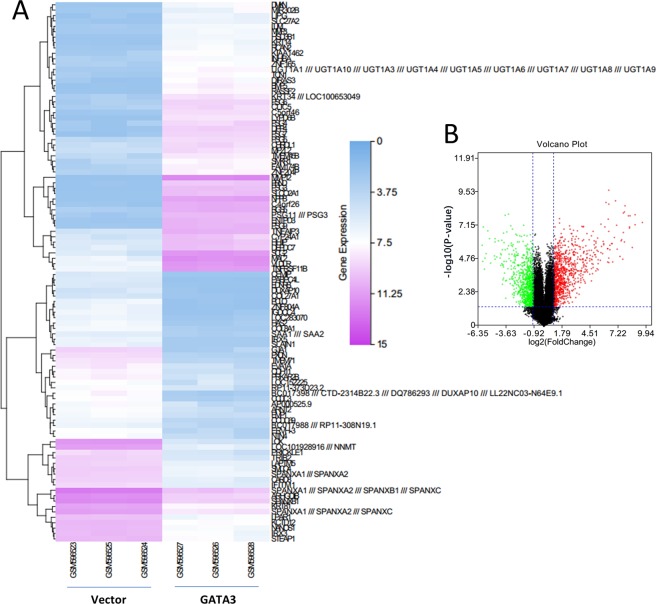
Figure 8.
The DEGs of overexpressed GATA3 in the volcano plot and heatmap. (A) Heatmap of vector and GATA3 overexpression samples based on the identified 100 robust differentially expressed (50 top upregulated and 50 top downregulated) genes. The highest expression values of DEGs are displayed in pink, and the lower expression values gradually fade toward white color. the lowest expression values of DEGs are shown in blue, with higher values gradually fading toward white color. (B) The volcano plot shows the DEG distributions in both up- and downregulated genes. The green color shows the downregulated genes, while the red indicates the upregulated genes.

