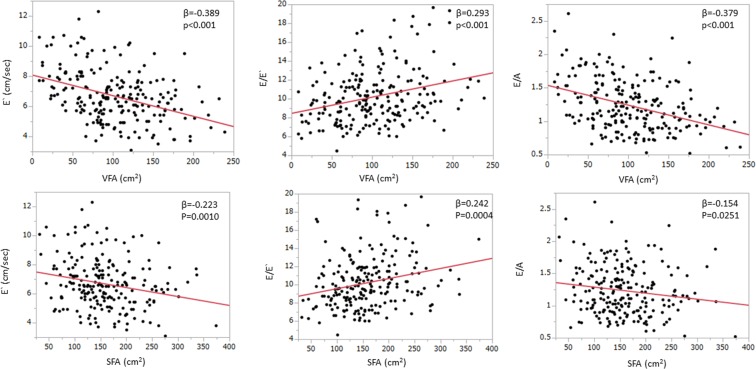
Figure 2.
Regression plots showing correlation between VFA (visceral fat area), SFA (subcutaneous fat area) and diastolic parameters (E′, E/E′, E/A). VFA had significant correlations with all of these diastolic parameters and was also an independent determinant of them. SFA also showed the significant association with diastolic parameters like that obtained with VFA, although the associations were relatively weaker compared to those of VFA.

